Spring 2023 Solar Industry Update
Capacity Factor
35%
30%
25%
20%
15%
10%
5%
0%
2014
Source: EIA, Form 923.
U.S. CSP Project Generation
Performance, 2014-2022
2015
2016
2017
2018
2019
2020
2021
2022
SEGS III-IX
(Trough)
Nevada Solar One
(Trough)
Genesis (Trough)
Solana (Trough+6
hours storage)
Mojave (Trough)
-Tonopah
(Tower+10 hours
storage)
-Ivanpah (Tower)
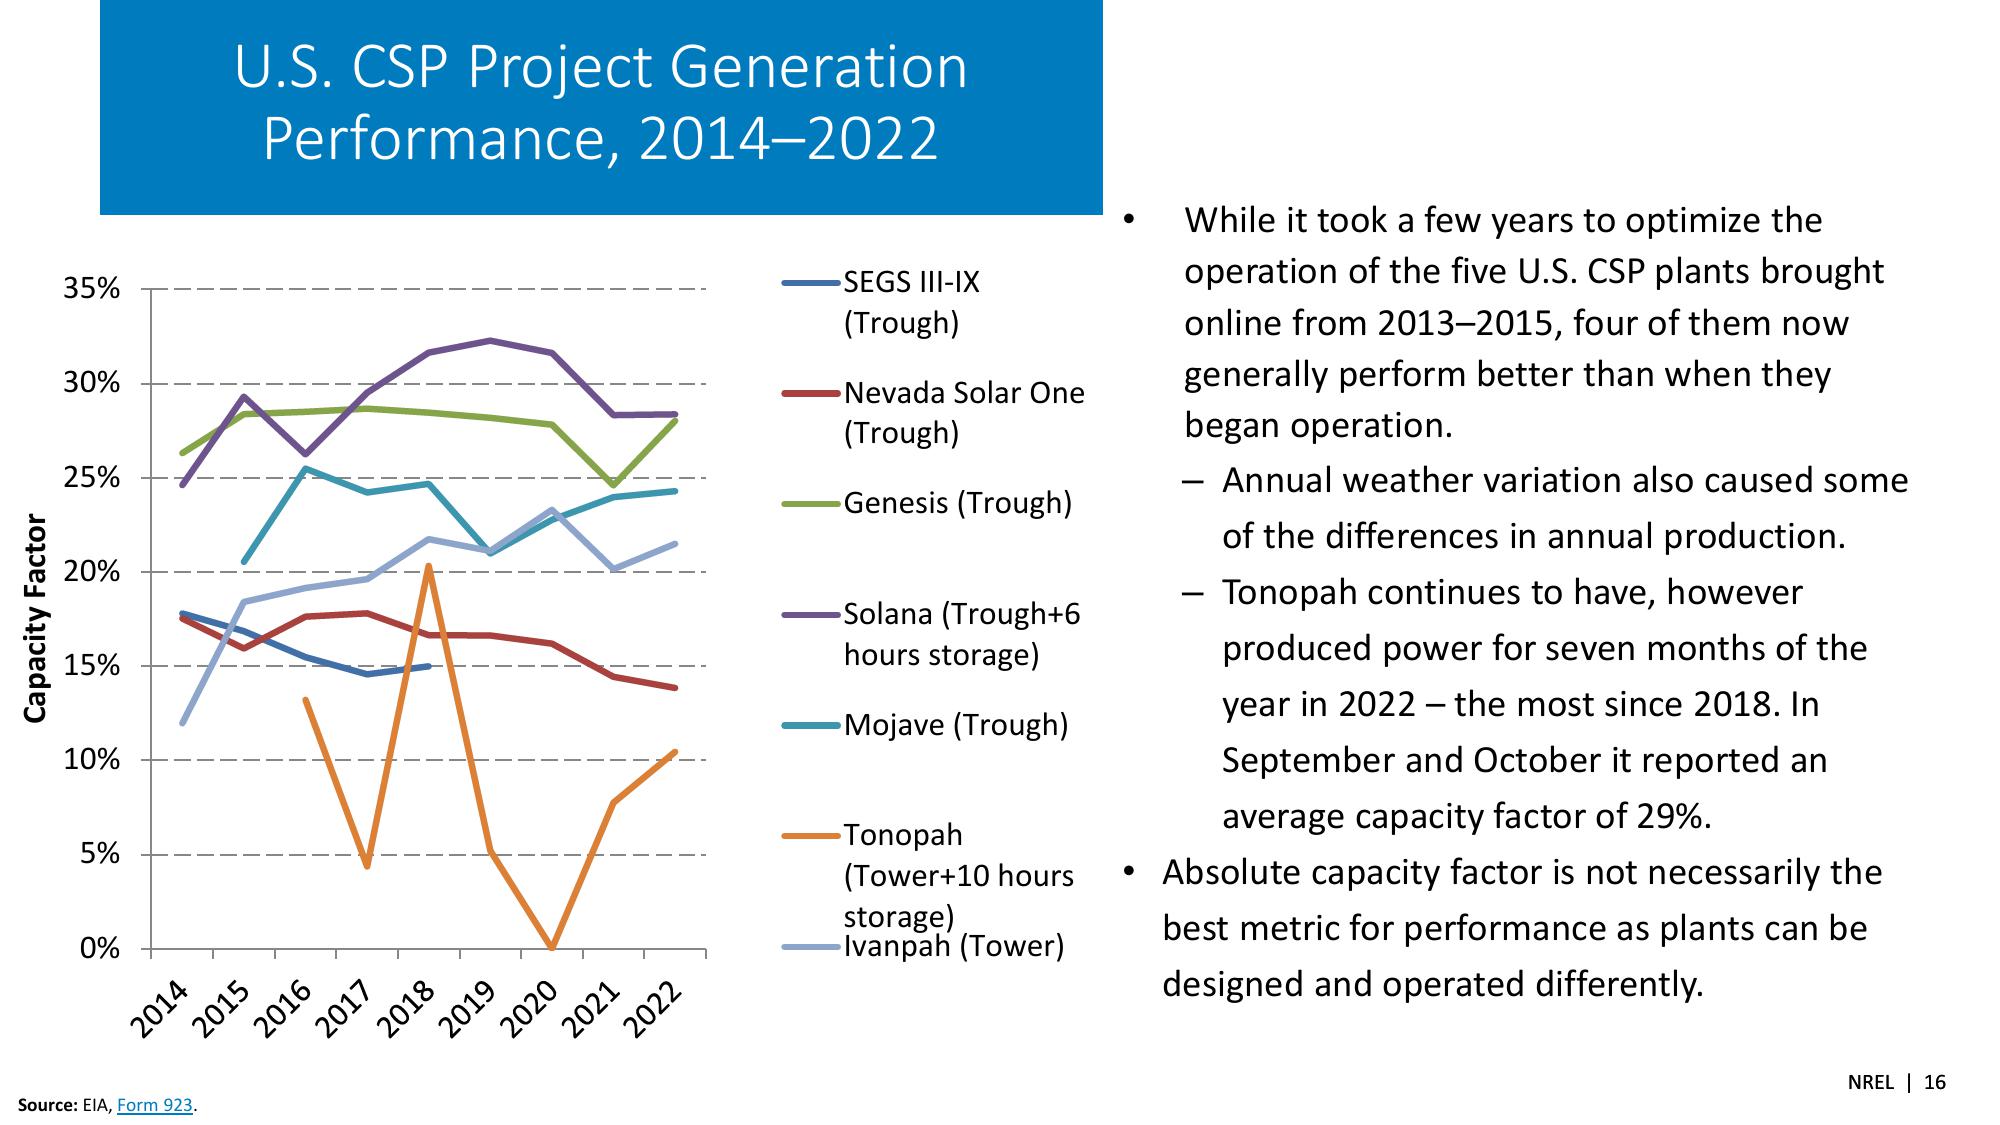
While it took a few years to optimize the
operation of the five U.S. CSP plants brought
online from 2013-2015, four of them now
generally perform better than when they
began operation.
-
Annual weather variation also caused some
of the differences in annual production.
- Tonopah continues to have, however
produced power for seven months of the
year in 2022 - the most since 2018. In
September and October it reported an
average capacity factor of 29%.
Absolute capacity factor is not necessarily the
best metric for performance as plants can be
designed and operated differently.
NREL 16View entire presentation