Nuvei Results Presentation Deck
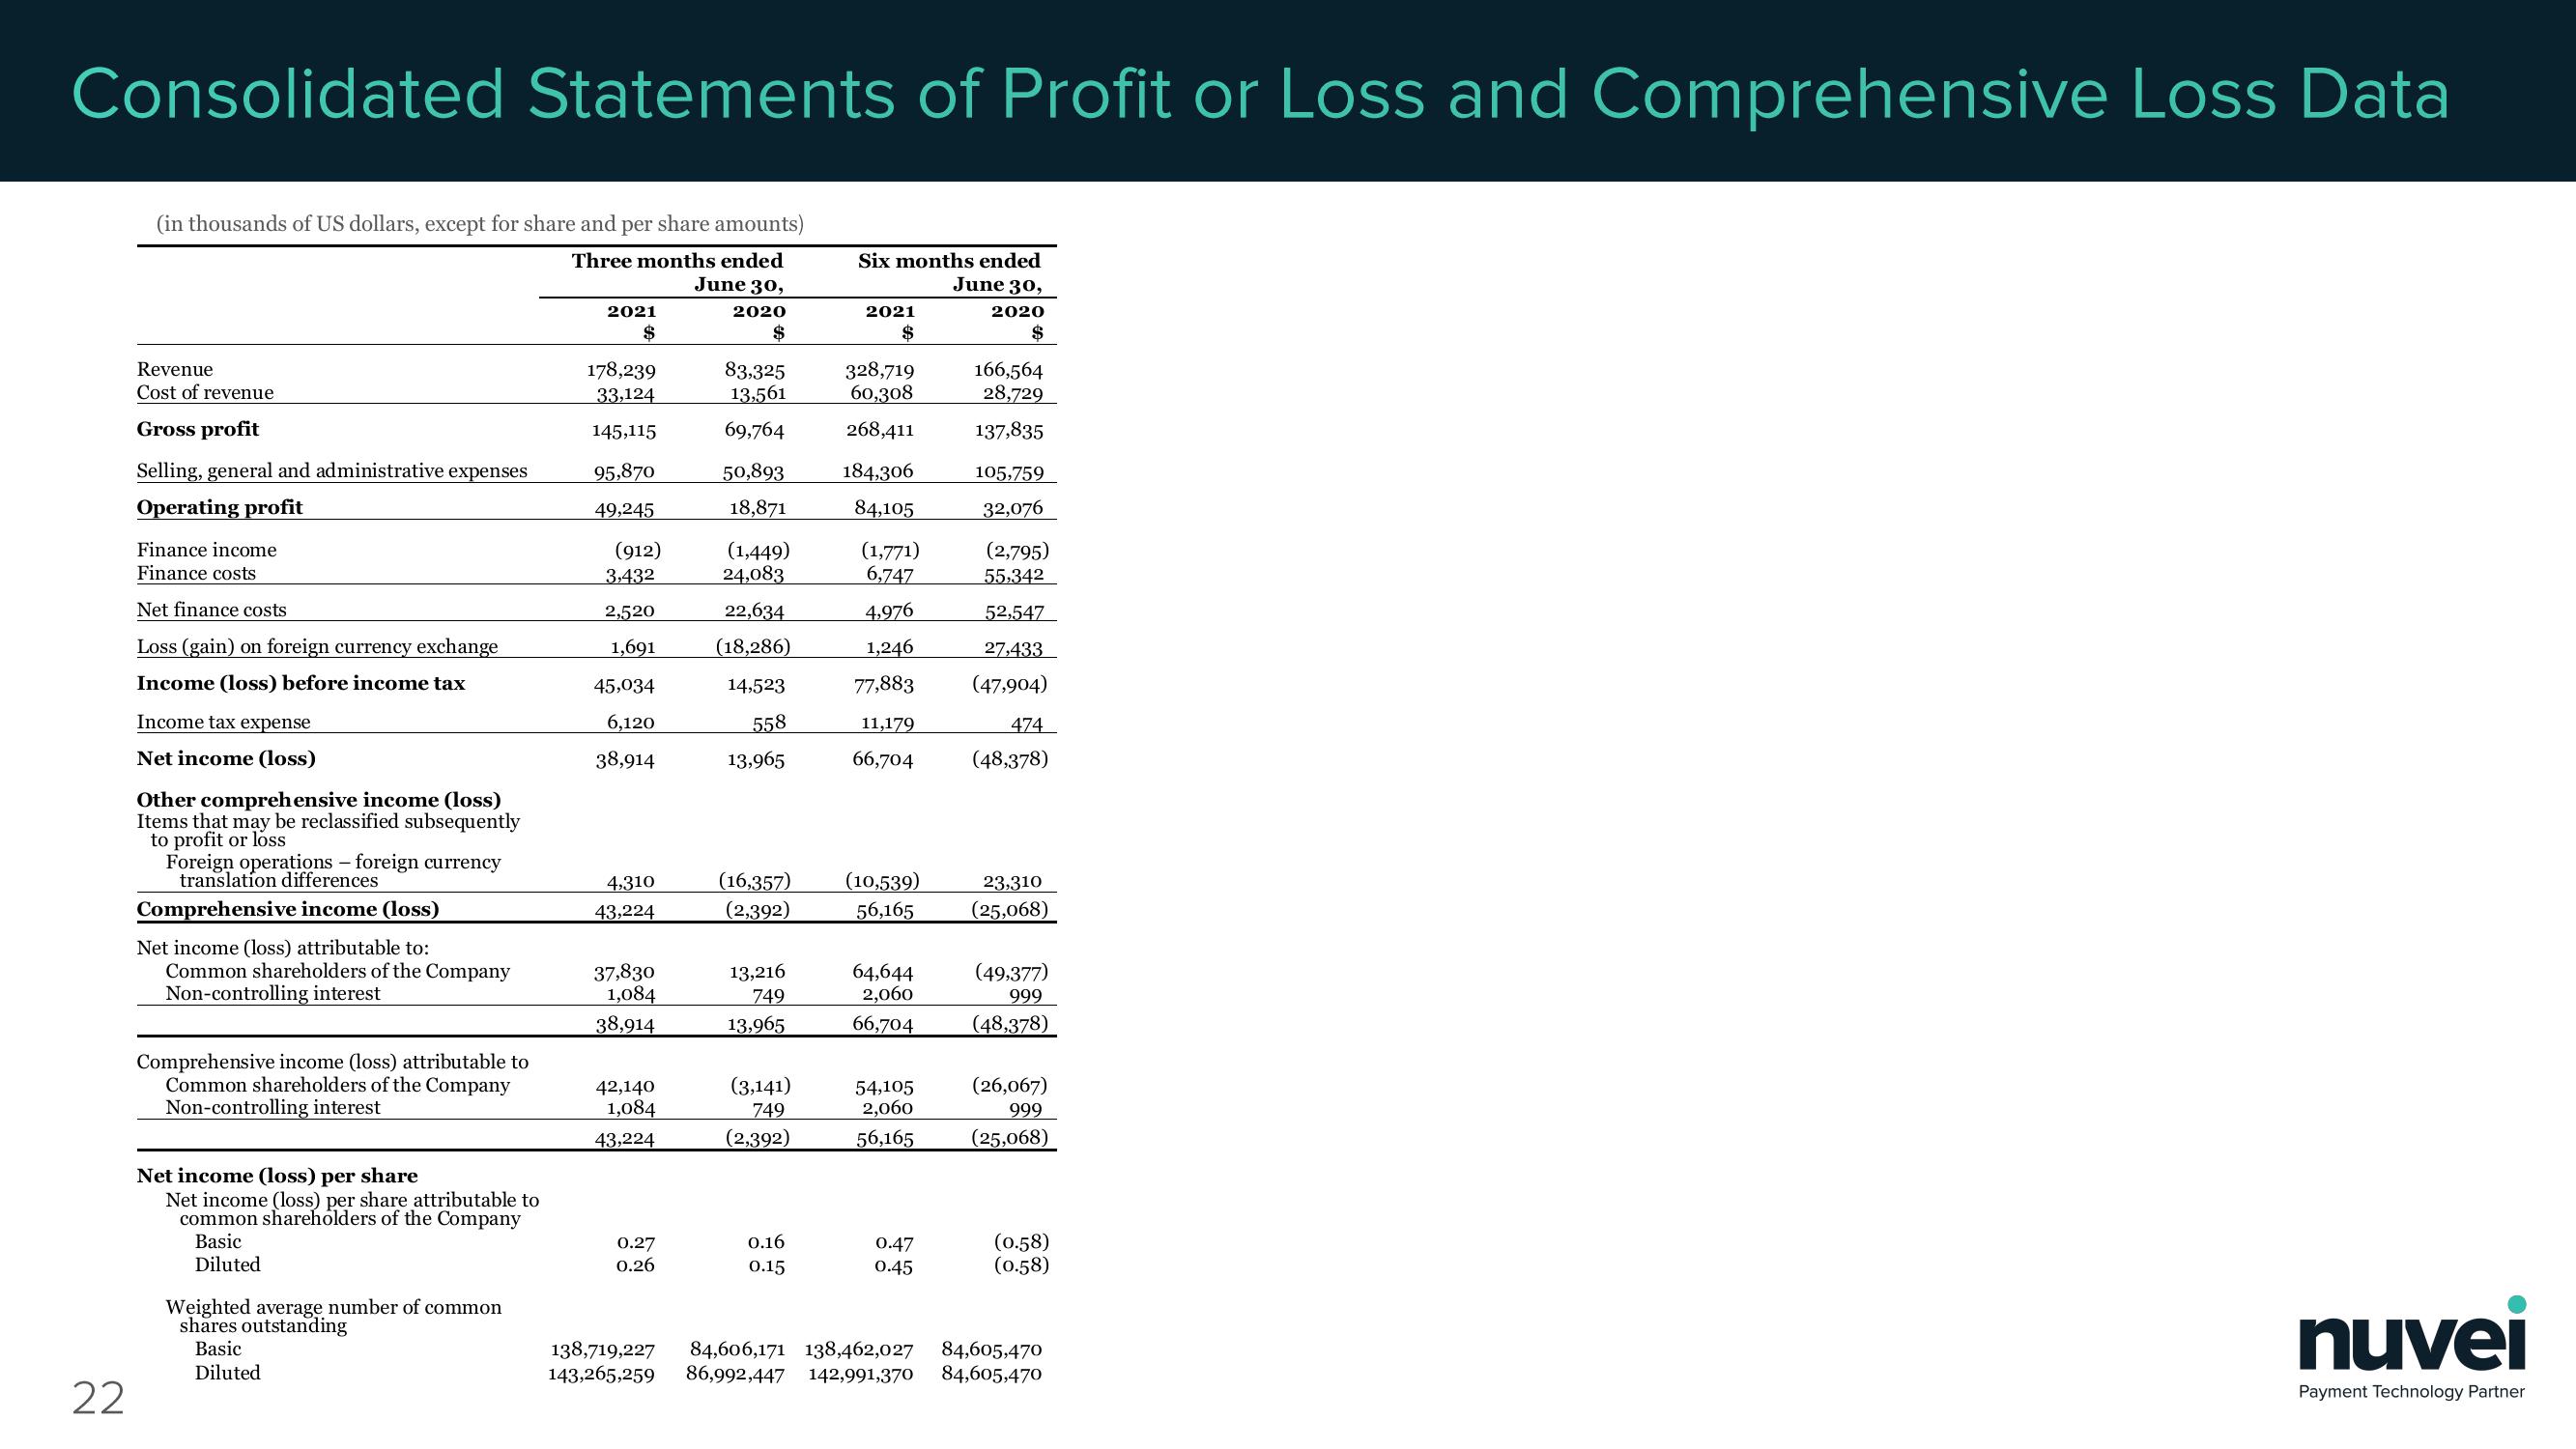
Consolidated Statements of Profit or Loss and Comprehensive Loss Data
22
(in thousands of US dollars, except for share and per share amounts)
Three months ended
June 30,
2020
$
Revenue
Cost of revenue
Gross profit
Selling, general and administrative expenses
Operating profit
Finance income
Finance costs
Net finance costs
Loss (gain) on foreign currency exchange
Income (loss) before income tax
Income tax expense
Net income (loss)
Other comprehensive income (loss)
Items that may be reclassified subsequently
to profit or loss
Foreign operations - foreign currency
translation differences
Comprehensive income (loss)
Net income (loss) attributable to:
Common shareholders of the Company
Non-controlling interest
Comprehensive income (loss) attributable to
Common shareholders of the Company
Non-controlling interest
Net income (loss) per share
Net income (loss) per share attributable to
common shareholders of the Company
Basic
Diluted
Weighted average number of common
shares outstanding
Basic
Diluted
2021
$
178,239
33,124
145,115
95,870
49,245
(912)
3,432
2,520
1,691
45,034
6,120
38,914
4,310
43,224
37,830
1,084
38,914
42,140
1,084
43,224
0.27
0.26
83,325
13,561
69,764
50,893
18,871
(1,449)
24,083
22,634
(18,286)
14,523
558
13,965
13,216
749
13,965
(3,141)
749
(2,392)
Six months ended
June 30,
2020
$
0.16
0.15
2021
328,719
60,308
268,411
184,306
84,105
(16,357) (10,539)
(2,392)
56,165
(1,771)
6,747
4,976
1,246
77,883
11,179
66,704
64,644
2,060
66,704
54,105
2,060
56,165
0.47
0.45
166,564
28,729
137,835
105,759
32,076
(2,795)
55,342
52,547
27,433
(47,904)
474
(48,378)
23,310
(25,068)
(49,377)
999
(48,378)
(26,067)
999
(25,068)
(0.58)
(0.58)
138,719,227 84,606,171 138,462,027
84,605,470
143,265,259 86,992,447 142,991,370 84,605,470
nuvei
Payment Technology PartnerView entire presentation