Commercial Metals Company Investor Presentation Deck
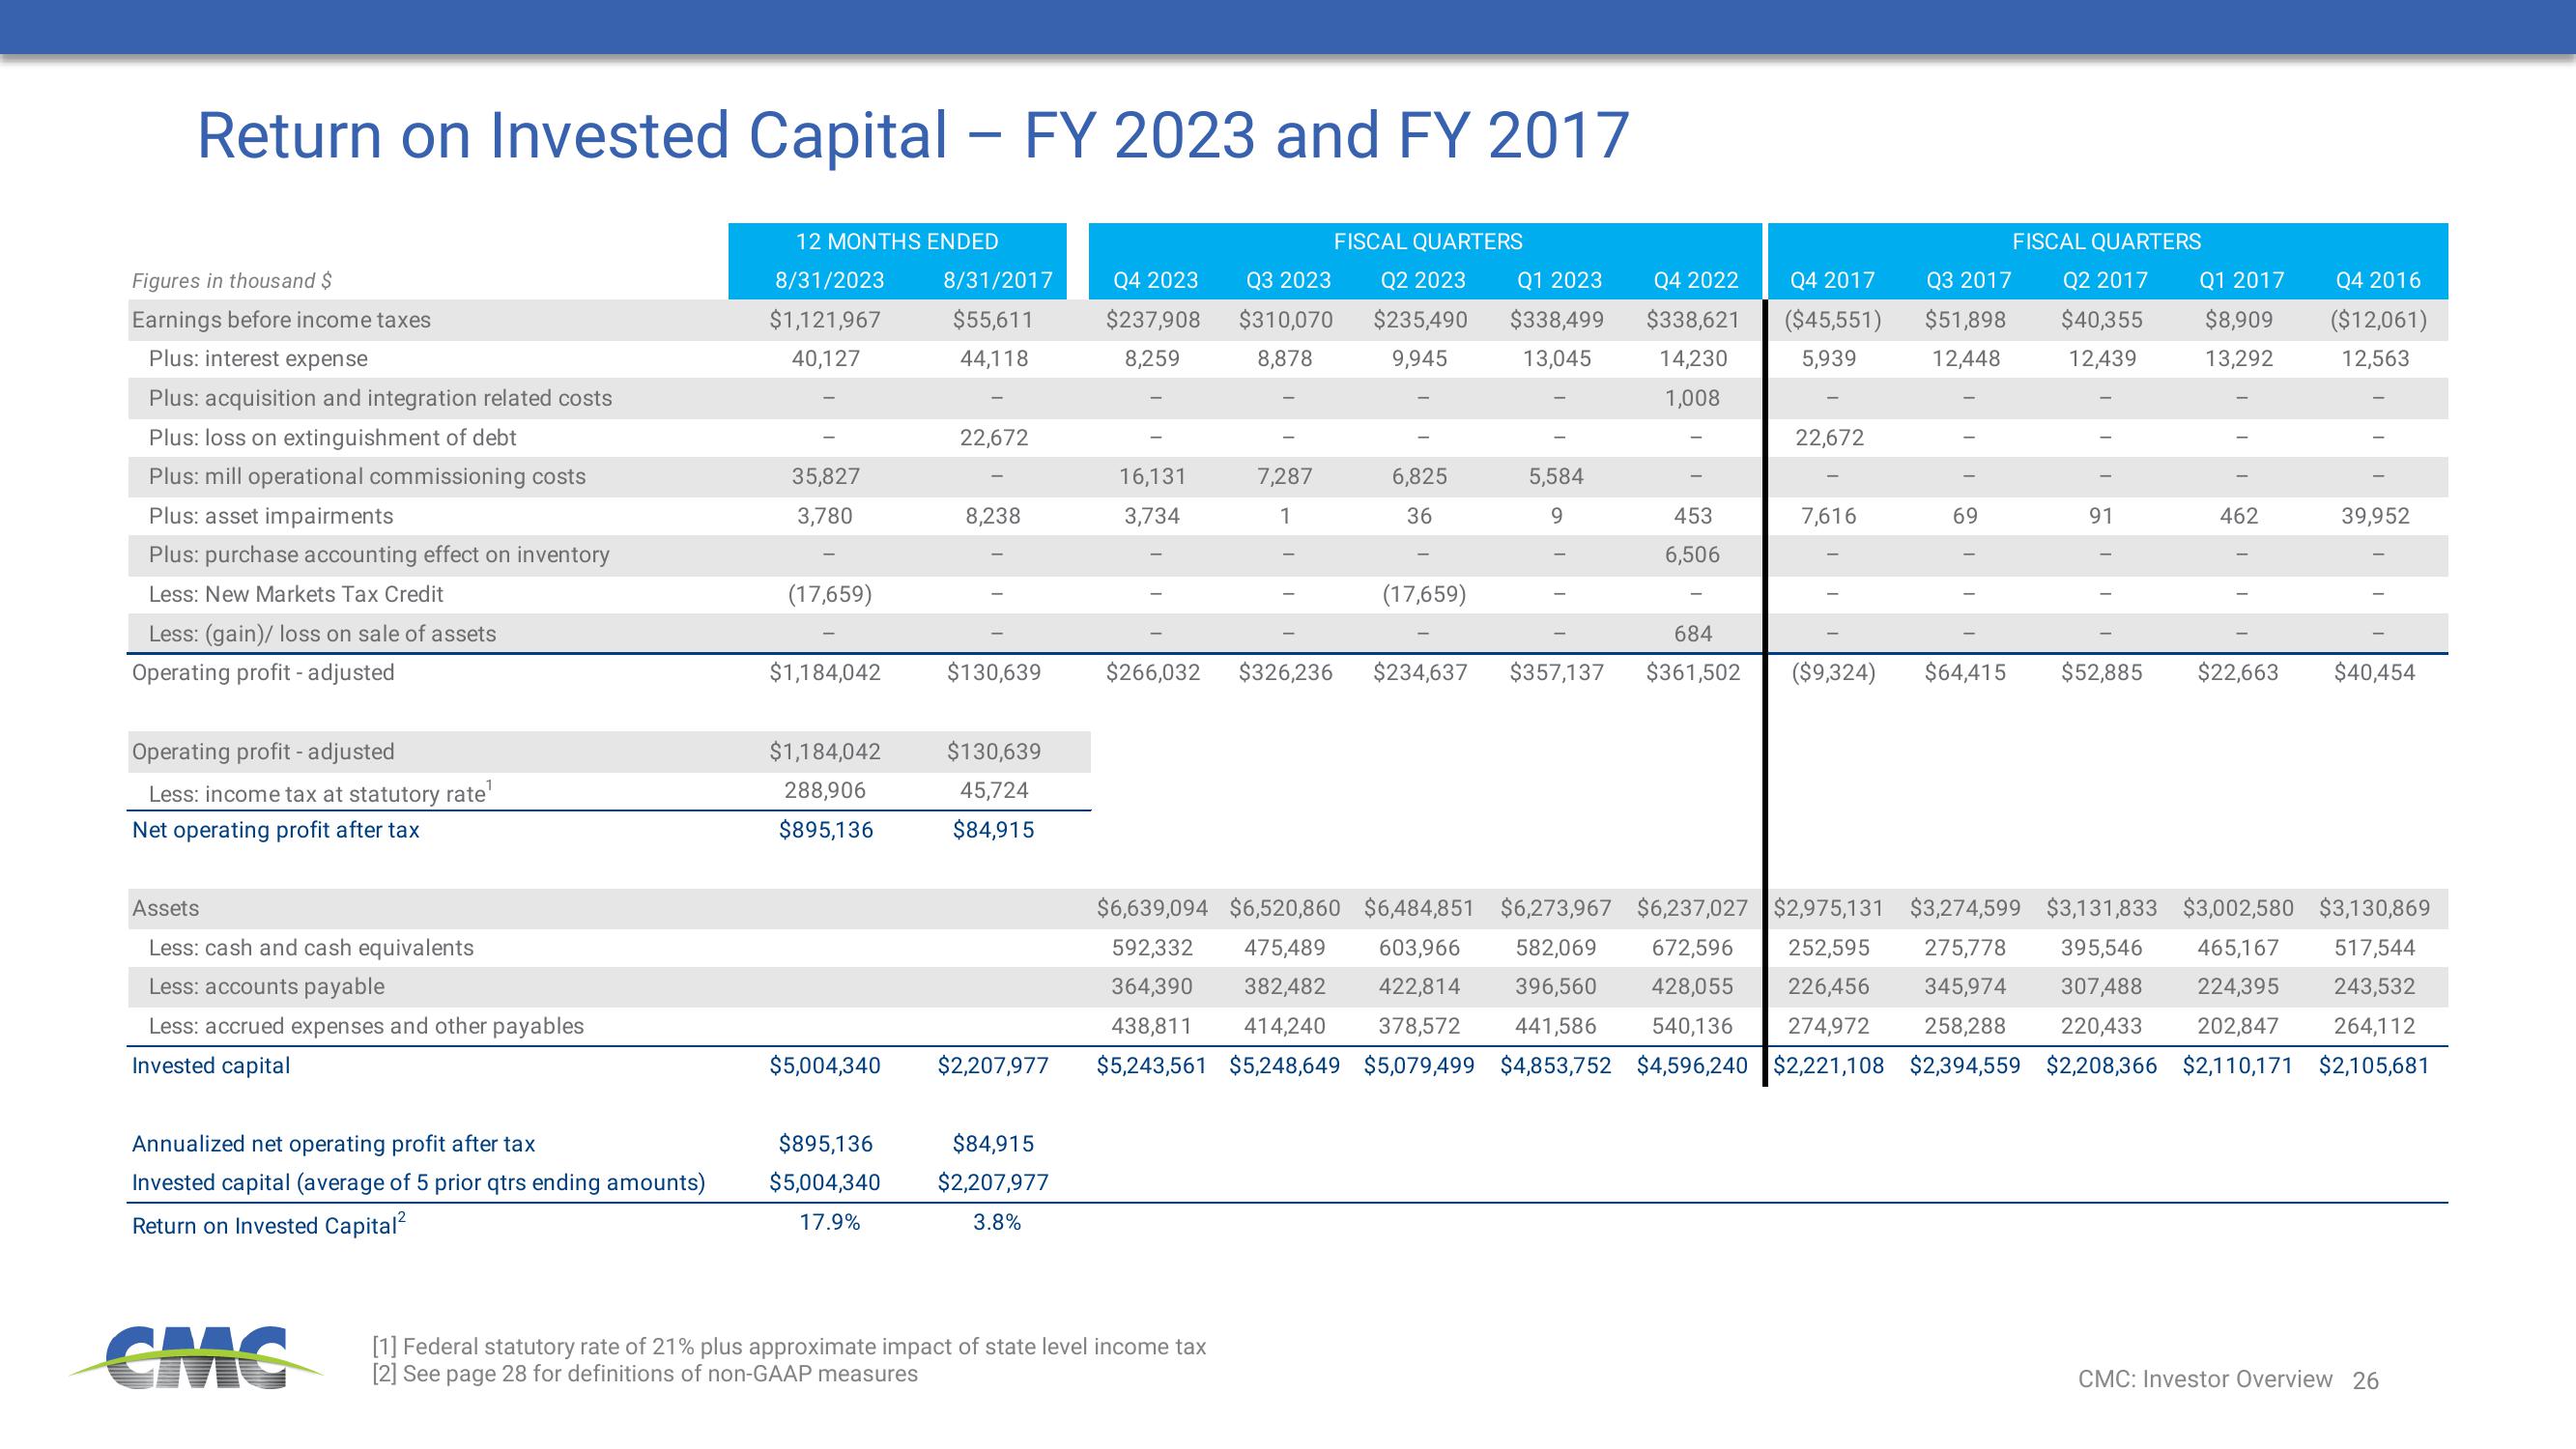
Return on Invested Capital - FY 2023 and FY 2017
FISCAL QUARTERS
Q2 2023
$235,490
9,945
Figures in thousand $
Earnings before income taxes
Plus: interest expense
Plus: acquisition and integration related costs
Plus: loss on extinguishment of debt
Plus: mill operational commissioning costs
Plus: asset impairments
Plus: purchase accounting effect on inventory
Less: New Markets Tax Credit
Less: (gain)/ loss on sale of assets
Operating profit - adjusted
Operating profit - adjusted
Less: income tax at statutory rate¹
Net operating profit after tax
Assets
Less: cash and cash equivalents
Less: accounts payable
Less: accrued expenses and other payables
Invested capital
Annualized net operating profit after tax
Invested capital (average of 5 prior qtrs ending amounts)
Return on Invested Capital²
GMC
12 MONTHS ENDED
8/31/2023
$1,121,967
40,127
35,827
3,780
(17,659)
$1,184,042
$1,184,042
288,906
$895,136
$5,004,340
$895,136
$5,004,340
17.9%
8/31/2017
$55,611
44,118
22,672
8,238
$130,639
$130,639
45,724
$84,915
$2,207,977
$84,915
$2,207,977
3.8%
Q4 2023 Q3 2023
$237,908 $310,070
8,259
8,878
16,131
3,734
7,287
1
$266,032 $326,236
[1] Federal statutory rate of 21% plus approximate impact of state level income tax
[2] See page 28 for definitions of non-GAAP measures
6,825
36
(17,659)
Q1 2023
$338,499
13,045
5,584
9
$234,637 $357,137
Q4 2022
$338,621
14,230
1,008
453
6,506
Q4 2017
($45,551)
5,939
22,672
7,616
Q3 2017
$51,898
12,448
69
684
$361,502 ($9,324) $64,415
FISCAL QUARTERS
Q2 2017
$40,355
12,439
91
Q1 2017
$8,909
13,292
462
Q4 2016
($12,061)
12,563
39,952
$52,885 $22,663 $40,454
465,167
517,544
$6,639,094 $6,520,860 $6,484,851 $6,273,967 $6,237,027 $2,975,131 $3,274,599 $3,131,833 $3,002,580 $3,130,869
592,332 475,489 603,966 582,069 672,596 252,595 275,778 395,546
364,390 382,482 422,814 396,560 428,055 226,456 345,974 307,488
438,811 414,240 378,572 441,586 540,136 274,972 258,288 220,433 202,847
$5,243,561 $5,248,649 $5,079,499 $4,853,752 $4,596,240 $2,221,108 $2,394,559 $2,208,366 $2,110,171 $2,105,681
224,395
243,532
264,112
CMC: Investor Overview 26View entire presentation