JD Sports Results Presentation Deck
September 2021
Revenue
EBITDA
Depreciation
Operating Profit Excl Exceptionals
Finance Costs (incl Lease Interest)
Profit Before Tax & Exceptional Items
Divisional Profit - Sports Fashion
Divisional Profit - Outdoor
Group Funding Costs
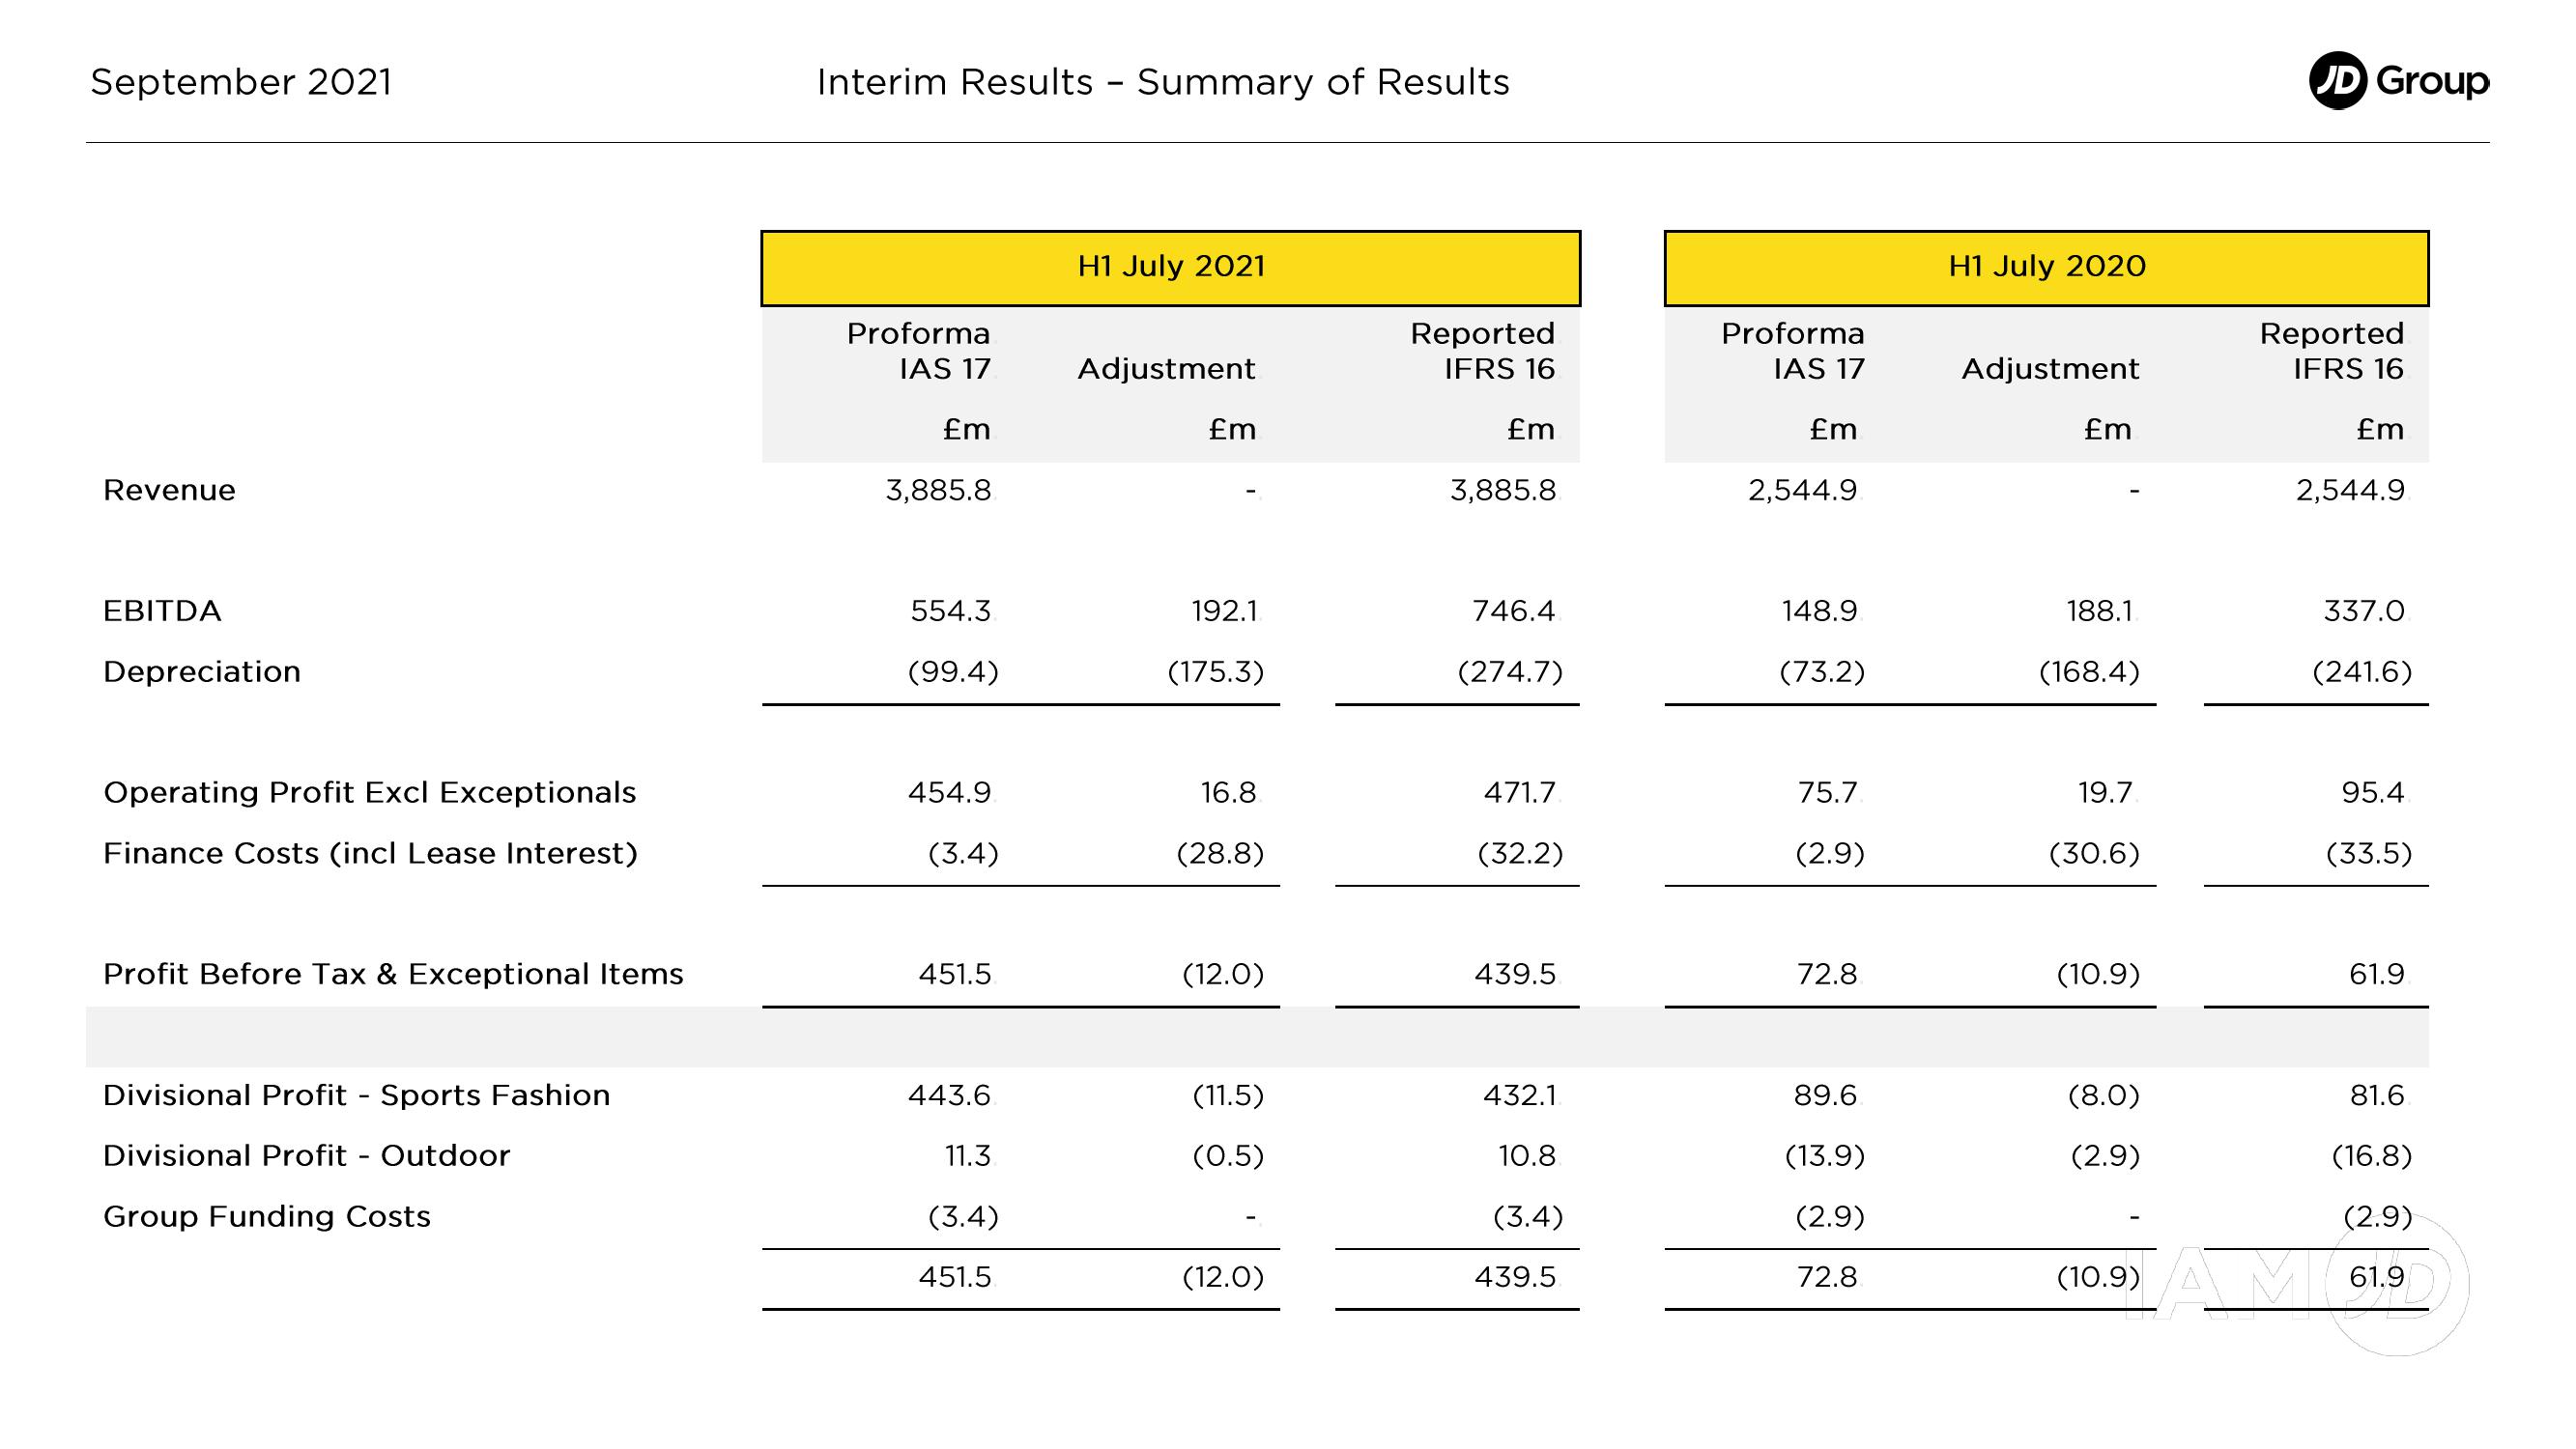
Interim Results - Summary of Results
Proforma
IAS 17
£m
3,885.8
554.3
(99.4)
454.9
(3.4)
451.5
443.6
11.3
(3.4)
451.5
H1 July 2021
Adjustment
£m
192.1
(175.3)
16.8
(28.8)
(12.0)
(11.5)
(0.5)
(12.0)
Reported
IFRS 16
£m
3,885.8
746.4
(274.7)
471.7
(32.2)
439.5
432.1
10.8
(3.4)
439.5
Proforma
IAS 17
£m
2,544.9
148.9
(73.2)
75.7
(2.9)
72.8
89.6
(13.9)
(2.9)
72.8
H1 July 2020
Adjustment
£m
188.1
(168.4)
19.7
(30.6)
(10.9)
(8.0)
(2.9)
JD Group
Reported
IFRS 16
£m
2,544.9
337.0
(241.6)
95.4
(33.5)
61.9
81.6
(16.8)
(2.9)
61.9
(10.9) A6View entire presentation