Hugo Boss Investor Presentation Deck
PAGE 76
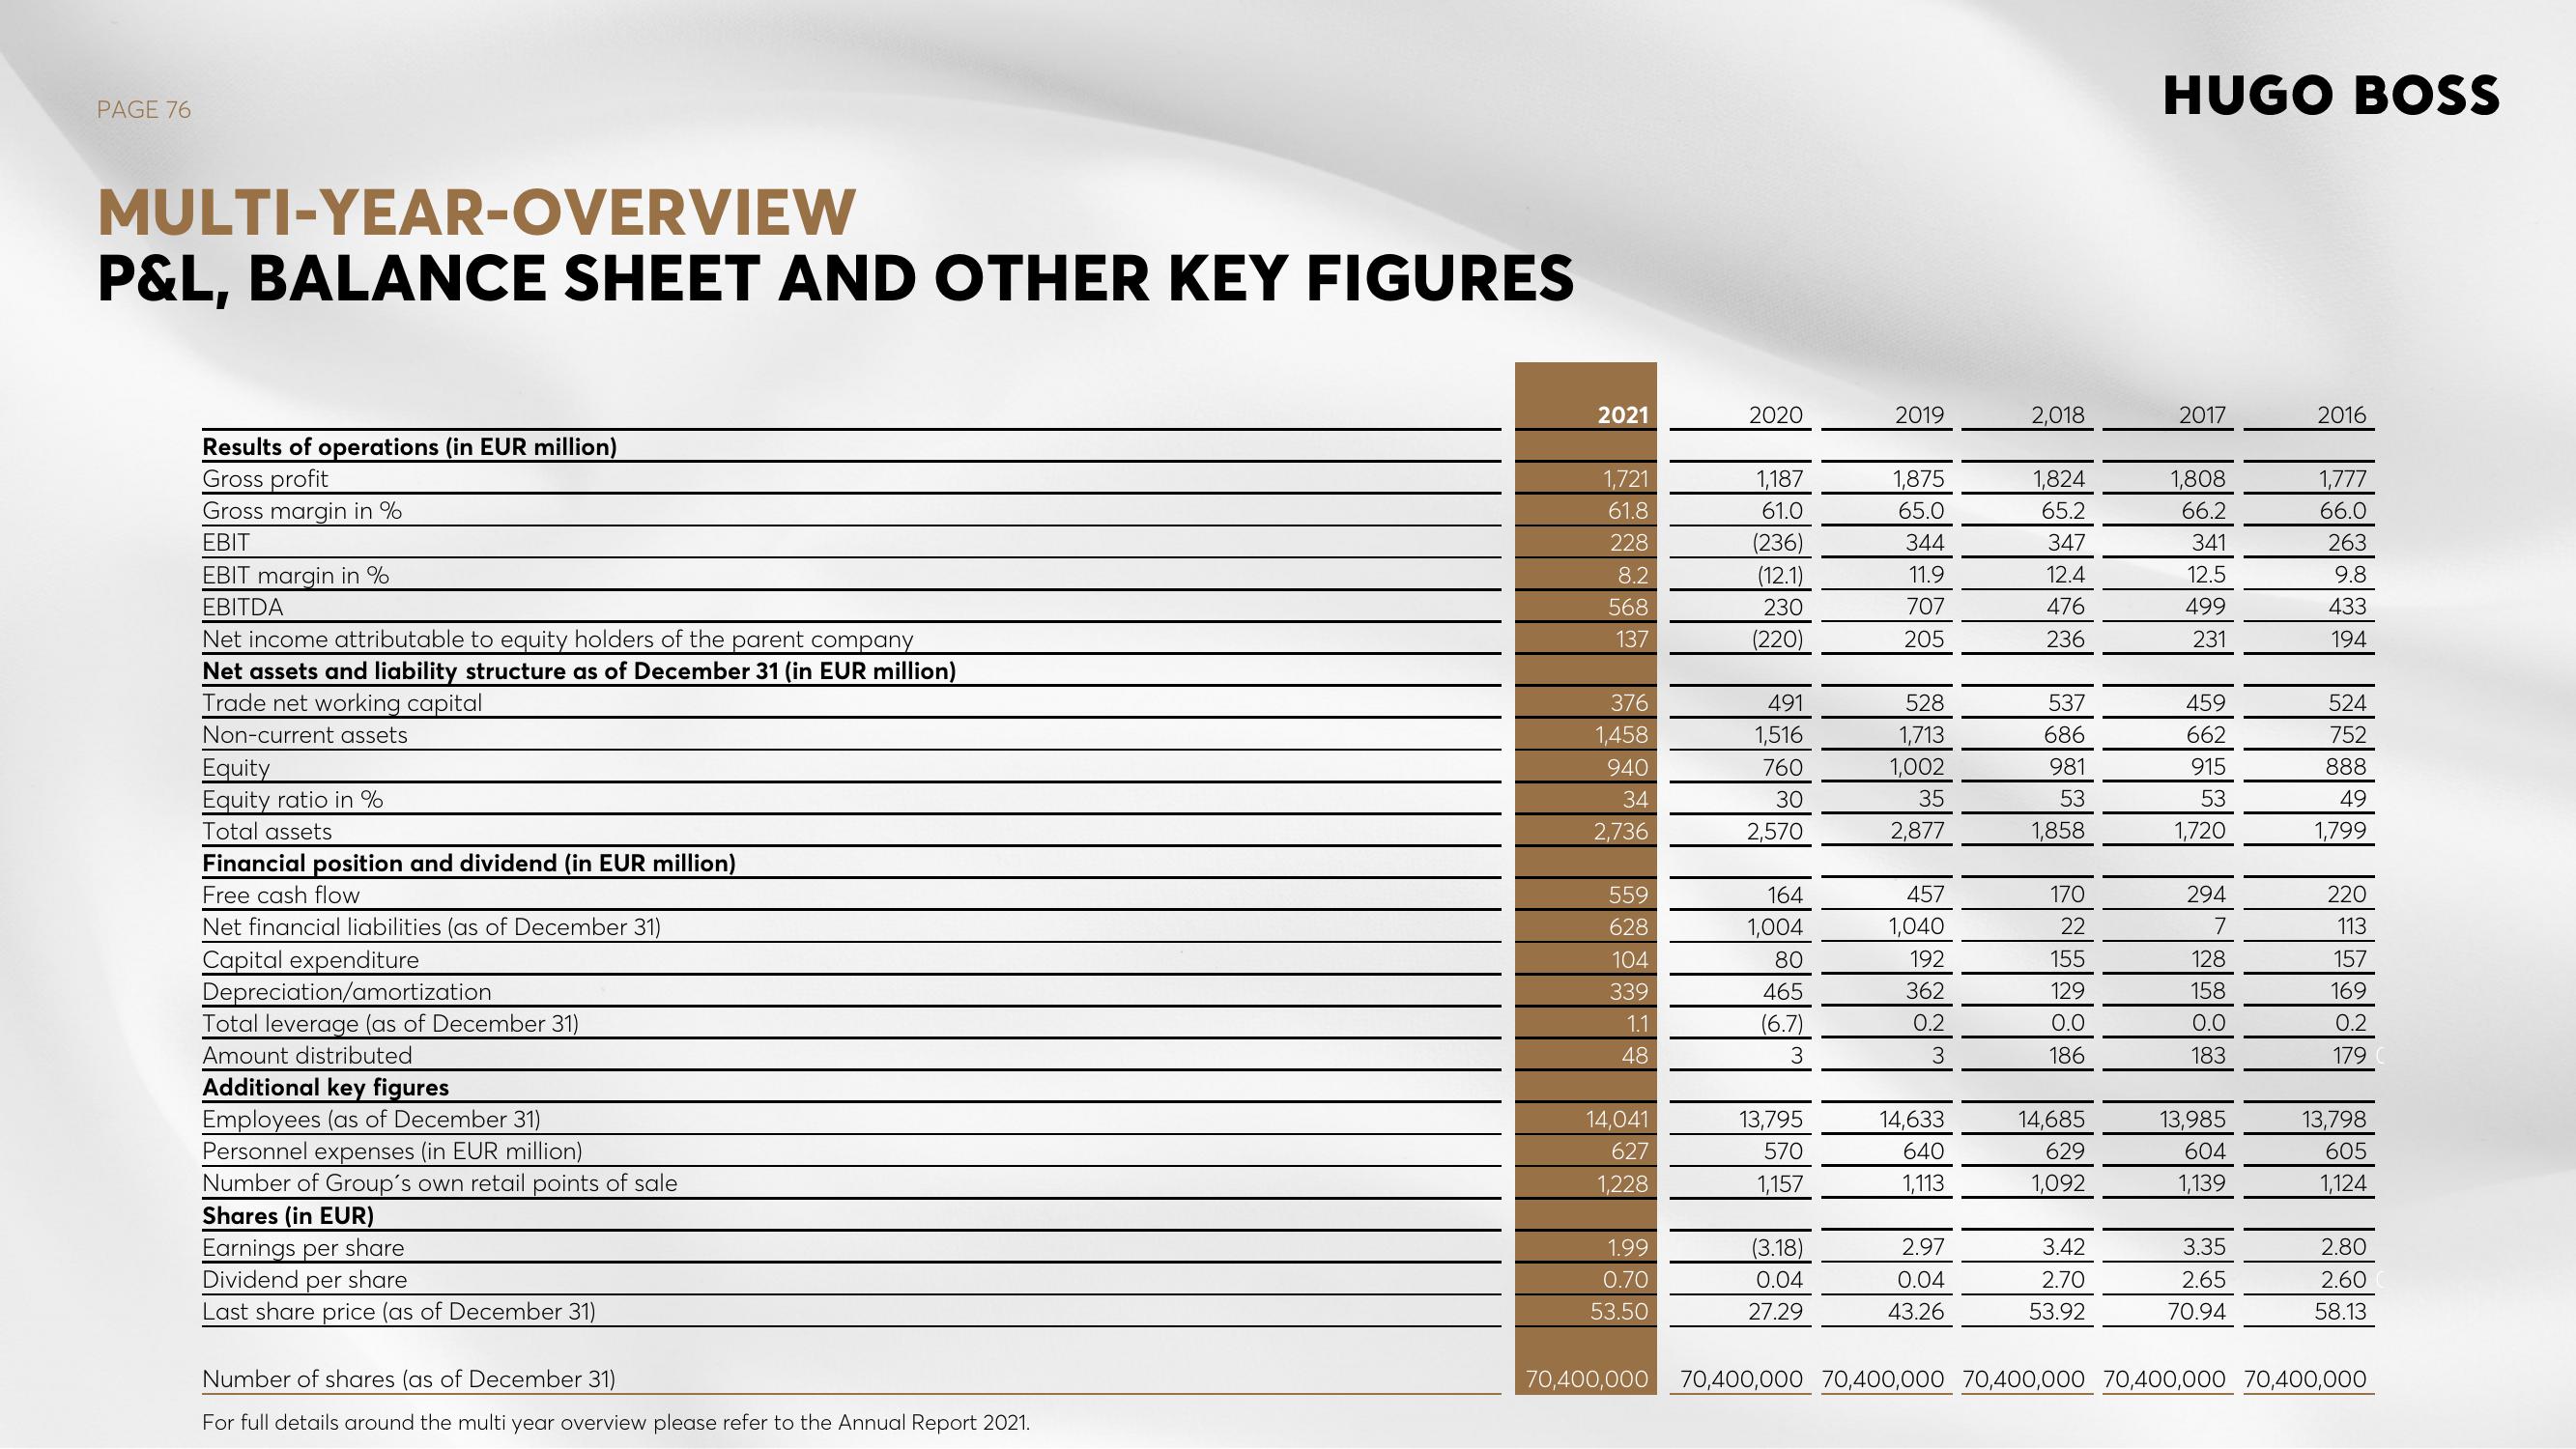
MULTI-YEAR-OVERVIEW
P&L, BALANCE SHEET AND OTHER KEY FIGURES
esults of operations (in EUR million)
Gross profit
Gross margin in %
EBIT
EBIT margin in %
EBITDA
Net income attributable to equity holders of the parent company
Net assets and liability structure as of December 31 (in EUR million)
Trade net working capital
Non-current assets
Equity
Equity ratio in %
Total assets
Financial position and dividend (in EUR million)
Free cash flow
Net financial liabilities (as of December 31)
Capital expenditure
Depreciation/amortization
Total leverage (as of December 31)
Amount distributed
Additional key figures
Employees (as of December 31)
Personnel expenses (in EUR million)
Number of Group's own retail points of sale
Shares (in EUR)
Earnings per share
Dividend per share
Last share price (as of December 31)
Number of shares (as of December 31)
For full details around the multi year overview please refer to the Annual Report 2021.
2021
1,721
61.8
228
8.2
568
137
376
1,458
940
34
2,736
559
628
104
339
1.1
48
14,041
627
1,228
1.99
0.70
53.50
2020
1,187
61.0
(236)
(12.1)
230
(220)
491
1,516
760
30
2,570
164
1,004
80
465
(6.7)
3
13,795
570
1,157
(3.18)
0.04
27.29
2019
1,875
65.0
344
11.9
707
205
528
1,713
1,002
35
2,877
457
1,040
192
362
0.2
3
14,633
640
1,113
2.97
0.04
43.26
2,018
1,824
65.2
347
12.4
476
236
537
686
981
53
1,858
170
22
155
129
0.0
186
14,685
629
1,092
3.42
2.70
53.92
HUGO BOSS
2017
1,808
66.2
341
12.5
499
231
WWWWW
459
662
915
1,720
294
7
128
158
0.0
183
13,985
604
1,139
3.35
2.65
70.94
2016
1,777
66.0
263
9.8
433
194
524
752
888
49
1,799
220
113
157
169
0.2
179
13,798
605
1,124
2.80
2.60
58.13
70,400,000 70,400,000 70,400,000 70,400,000 70,400,000 70,400,000View entire presentation