Asos Results Presentation Deck
© 2023 asos
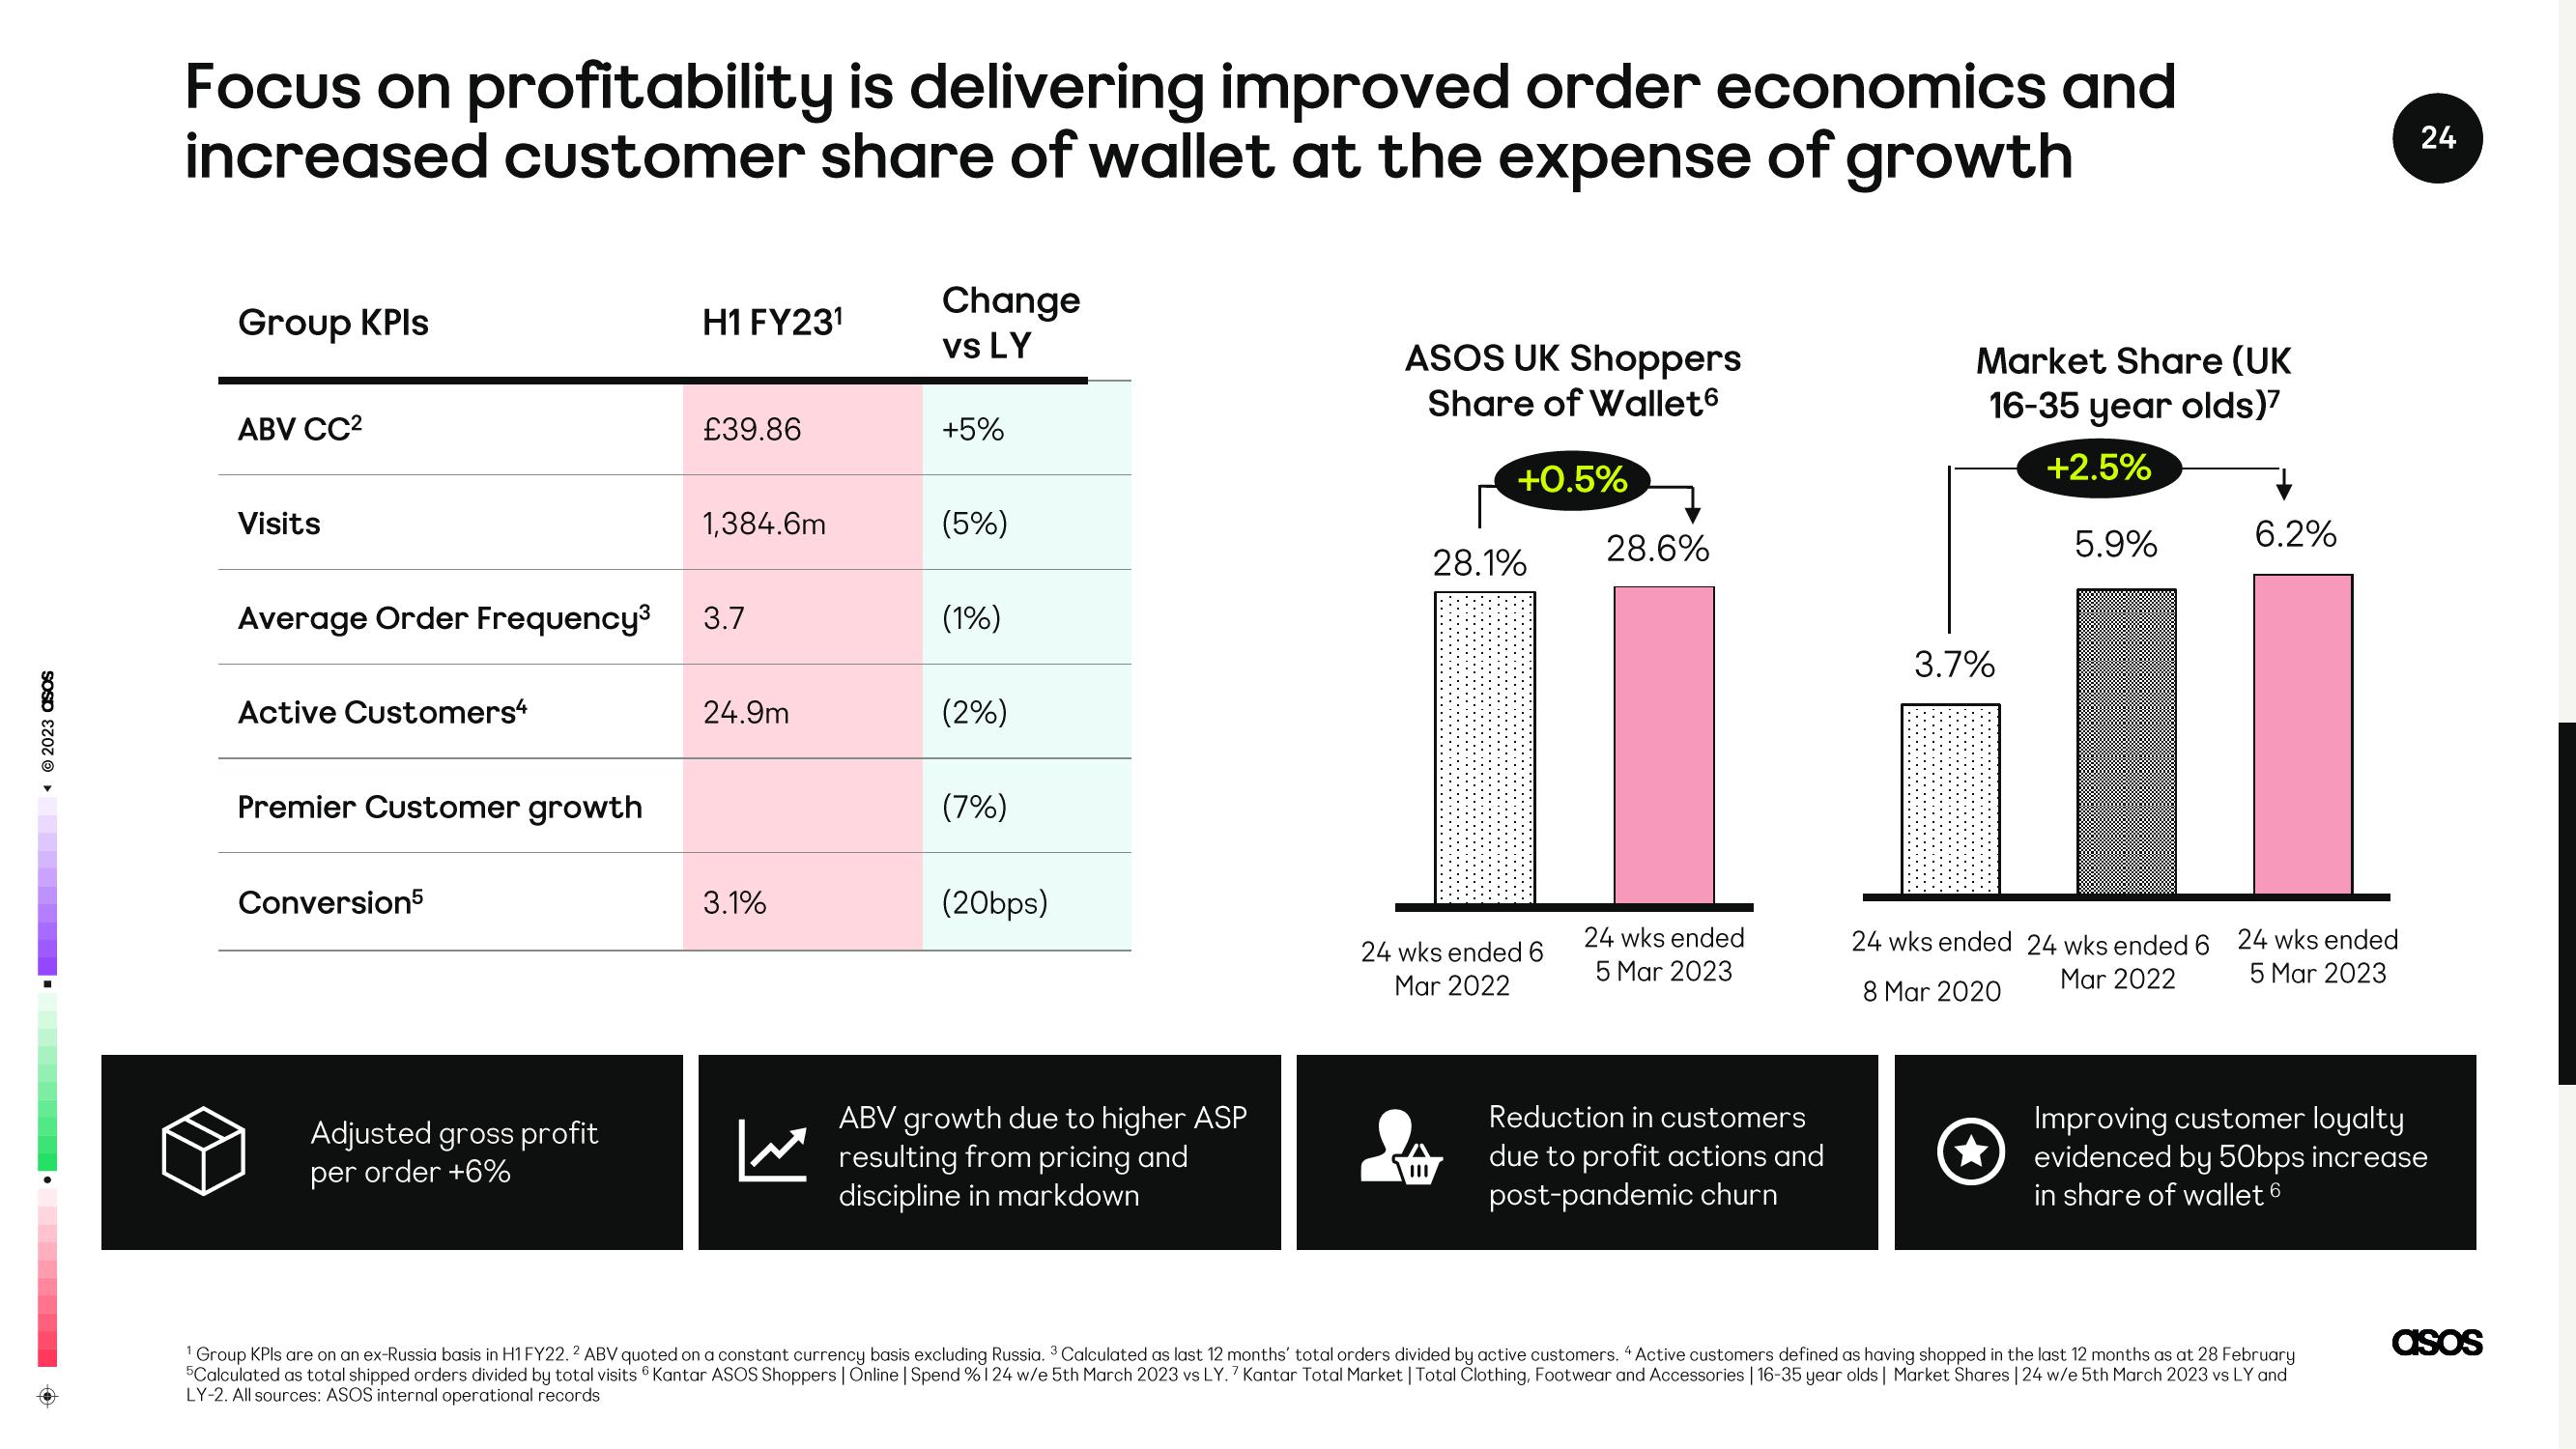
Focus on profitability is delivering improved order economics and
increased customer share of wallet at the expense of growth
Group KPIs
ABV CC²
Visits
Average Order Frequency³
Active Customers4
Premier Customer growth
Conversion5
Adjusted gross profit
per order +6%
H1 FY23¹
£39.86
1,384.6m
3.7
24.9m
3.1%
Change
vs LY
+5%
(5%)
(1%)
(2%)
(7%)
(20bps)
ABV growth due to higher ASP
resulting from pricing and
discipline in markdown
ASOS UK Shoppers
Share of Wallet6
+0.5%
28.1%
24 wks ended 6
Mar 2022
28.6%
24 wks ended
5 Mar 2023
Reduction in customers
due to profit actions and
post-pandemic churn
Market Share (UK
16-35 year olds)
+2.5%
5.9%
3.7%
6.2%
24 wks ended 24 wks ended 6 24 wks ended
Mar 2022
8 Mar 2020
5 Mar 2023
24
Improving customer loyalty
evidenced by 50bps increase
in share of wallet 6
1 Group KPIs are on an ex-Russia basis in H1 FY22. 2 ABV quoted on a constant currency basis excluding Russia. 3 Calculated as last 12 months' total orders divided by active customers. 4 Active customers defined as having shopped in the last 12 months as at 28 February
5Calculated as total shipped orders divided by total visits Kantar ASOS Shoppers | Online | Spend % 124 w/e 5th March 2023 vs LY. 7 Kantar Total Market | Total Clothing, Footwear and Accessories | 16-35 year olds | Market Shares | 24 w/e 5th March 2023 vs LY and
LY-2. All sources: ASOS internal operational records
asosView entire presentation