Shift SPAC Presentation Deck
Non-GAAP to GAAP Reconciliation
($ in Millions)
Adjusted Total Gross Profit
Adjustment to Cost of Goods Sold
GAAP Total Gross Profit
Adjusted Operating Profit (Loss)
Adjustment to Gross Profit
Adjustment to Operating Expenses
Stock-Based Compensation
GAAP Operating Profit (Loss)
Adjusted Net Income (Loss)
Adjustment to Gross Profit
Adjustment to Operating Expenses
Adjustment to Net Income
GAAP Net Income (Loss)
Q1A
$2.3
2.1
$0.2
($12.0)
2.1
8.5
0.3
($22.8)
($11.7)
2.1
8.5
1.1
($23.4)
Q2A
2019
$2.4
2.8
($0.4)
($13.5)
2.8
0.3
0.2
($16.7)
($13.6)
2.8
0.3
($17.7)
Q3A
$1.5
2.4
($0.9)
($14.6)
2.4
0.1
0.8
($17.9)
($15.4)
2.4
0.1
1.1
($19.0)
Q4A
$0.5
1.2
($0.7)
($13.6)
1.2
4.2
0.4
($19.3)
($14.0)
1.2
4.2
1.1
($20.5)
Q1A
$3.5
0.2
$3.3
($10.6)
0.2
(0.0)
0.3
($11.1)
($11.1)
0.2
(0.0)
1.1
($12.3)
Q2A
2020
$3.7
0.2
$3.6
($11.3)
0.2
0.7
($12.2)
($12.1)
0.2
6.7
($19.0)
Q3EA¹
$3.9
$3.9
($12.9)
0.4
($13.3)
($13.7)
($13.7)
Q4E
$4.1
$4.1
($16.8)
0.4
($17.2)
($17.7)
($17.7)
2018A
$5.4
$5.4
($40.0)
-
1.7
0.2
($41.8)
($40.1)
1.7
3.1
($44.9)
2019A
$6.7
8.5
($1.8)
($53.6)
8.5
13.1
1.7
($76.8)
($54.7)
8.5
13.1
4.2
($80.5)
2020E
$15.2
0.3
$14.9
($51.7)
0.3
(0.0)
1.8
($53.8)
($54.7)
0.3
(0.0)
7.8
($62.7)
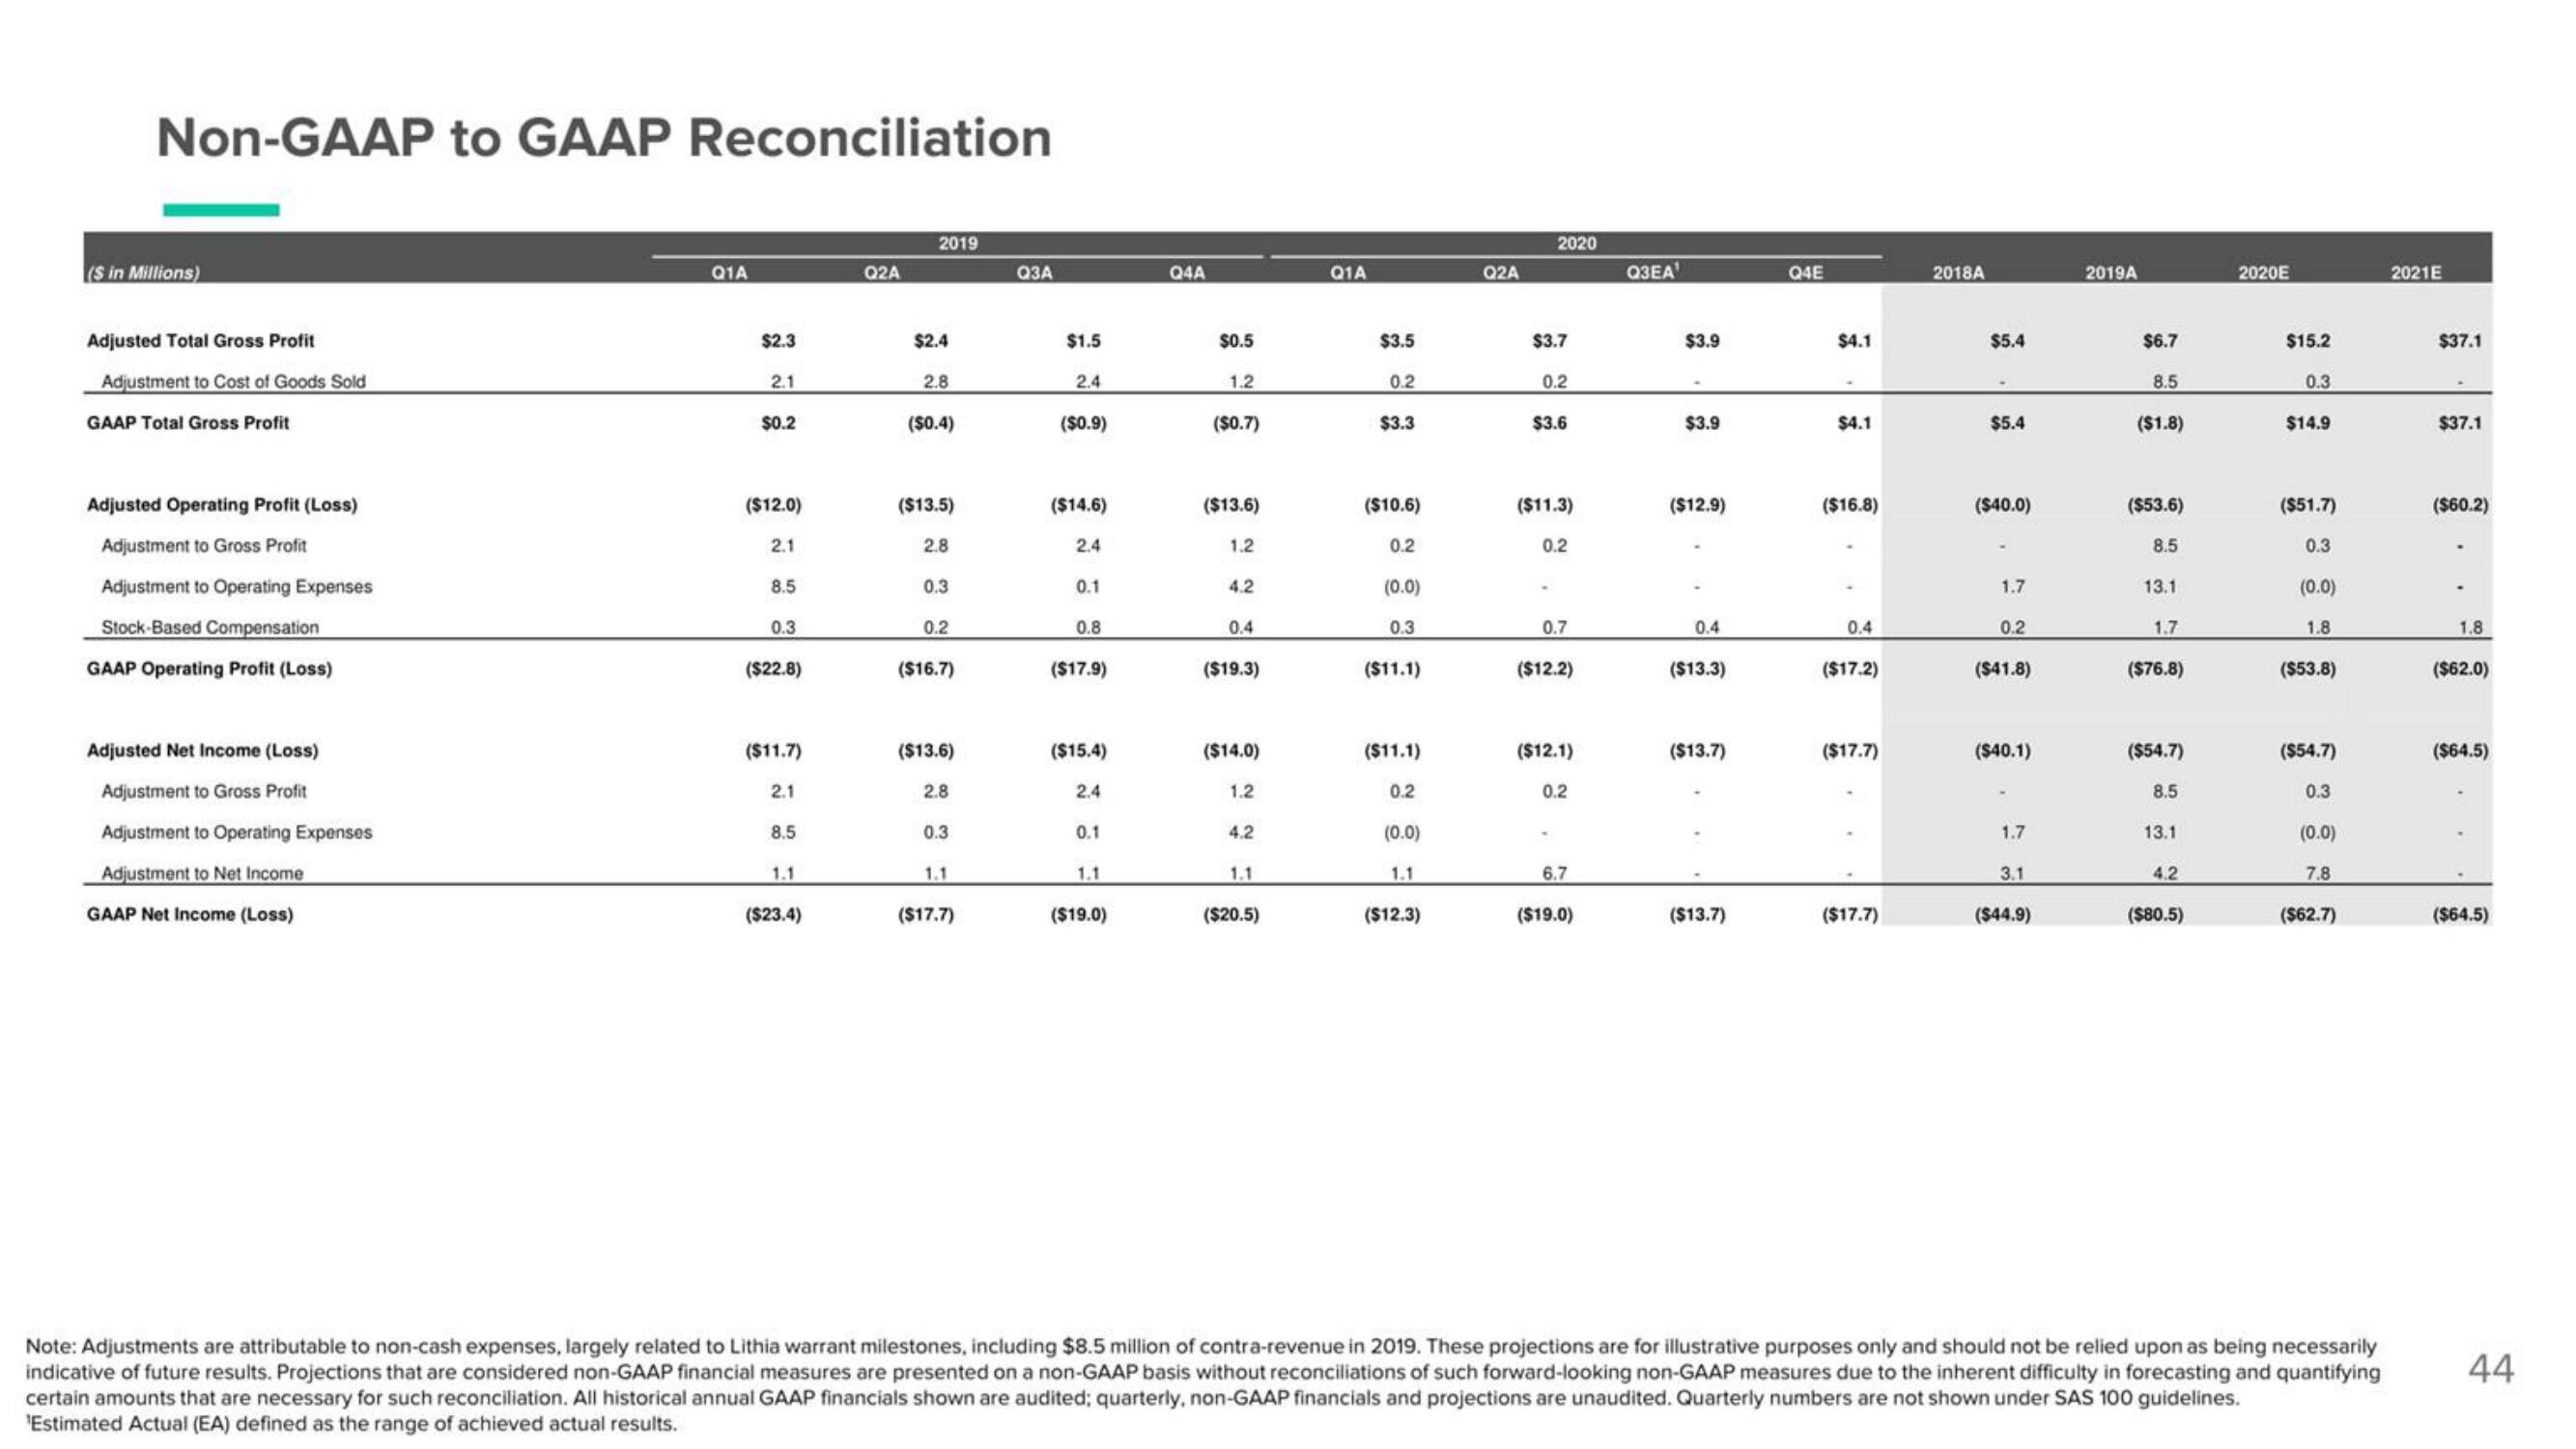
Note: Adjustments are attributable to non-cash expenses, largely related to Lithia warrant milestones, including $8.5 million of contra-revenue in 2019. These projections are for illustrative purposes only and should not be relied upon as being necessarily
indicative of future results. Projections that are considered non-GAAP financial measures are presented on a non-GAAP basis without reconciliations of such forward-looking non-GAAP measures due to the inherent difficulty in forecasting and quantifying
certain amounts that are necessary for such reconciliation. All historical annual GAAP financials shown are audited; quarterly, non-GAAP financials and projections are unaudited. Quarterly numbers are not shown under SAS 100 guidelines.
'Estimated Actual (EA) defined as the range of achieved actual results.
2021E
$37.1
$37.1
($60.2)
1.8
($62.0)
($64.5)
($64.5)
44View entire presentation