HUB Security SPAC Presentation Deck
Financial Projection Model
USD (Millions)
Revenue
Professional Services
Innovation & Tec.
Total Revenue
Professional Services COGS
Innovation & Tec. COGS
Cost of sales
Gross profit
Professional Services GM%
Innovation & Tec. GM%
Gross Margin %
Operating Expenses
Research & Development
Revenue %
Selling & marketing
Revenue %
General & administrative
Revenue %
Operating profit
Revenue %
EBITDA (3)
EBITDA Margin %
$
$
$
$
$
$
$
$
$
$
$
$
$
2020
67.0 $
1.6 $
68.6 $
57.7 $
0.8 $
58.5 $
10.1 $
13.9%
51.7%
14.8%
12.6 $
1.9 $
2.8%
3.1 $
4.6%
7.5 $
10.9%
(2.4) $
(3.6%)
(1.4) $
2021E
(2.1%)
(1)
76.4 $
1.8 $
78.3 $
66.2 $
0.8 $
67.0 $
11.2 $
13.4%
57.4%
14.4%
21.0 $
2.7 $
3.5%
5.6 $
7.2%
12.7 $
16.2%
(9.8) $
(12.5%)
(6.1) $
(7.8%)
:(2)
2022E
76.8 $
38.4 $
115.2 $
64.3 $
14.7 $
79.0 $
36.2 $
16.3%
61.7%
31.5%
2023E
29.3 $
6.6 $
5.8%
12.3 $
10.6%
10.4 $
9.0%
7.0 $
6.1%
10.9 $
9.4%
82.7 $
91.8 $
174.5 $
69.2 $
30.5 $
99.7 $
74.7 S
16.2%
66.8%
42.8%
2024E
60.3 $
15.6 $
8.9%
25.5 $
14.6%
19.2 $
11.0%
14.5 $
8.3%
20.6 $
11.8%
2025E
89.0 $ 95.9 $
175.3 $
348.9 $
264.3 $
444.8 $
74.6 $
80.5 $
55.5 $
109.9 $
130.1 $
190.4 $
134.2 $
254.4 $
16.2%
16.1%
68.4%
68.5%
50.8%
57.2%
181.4 $
50.3 $
11.3%
77.2 $
17.3%
53.9 $
12.1%
73.1
16.4%
$
95.6 $
99.7 $
27.2 $
10.3%
42.7 $
16.2%
29.9 $
11.3%
34.5 $
13.1%
45.0 $
17.0%
21.5%
H
HUB
2026E
103.4
608.5
712.0
86.8
178.5
265.3
446.6
16.1%
70.7%
62.7%
306.6
86.9
12.2%
123.7
17.4%
96.1
13.5%
140.0
19.7%
175.7
24.7%
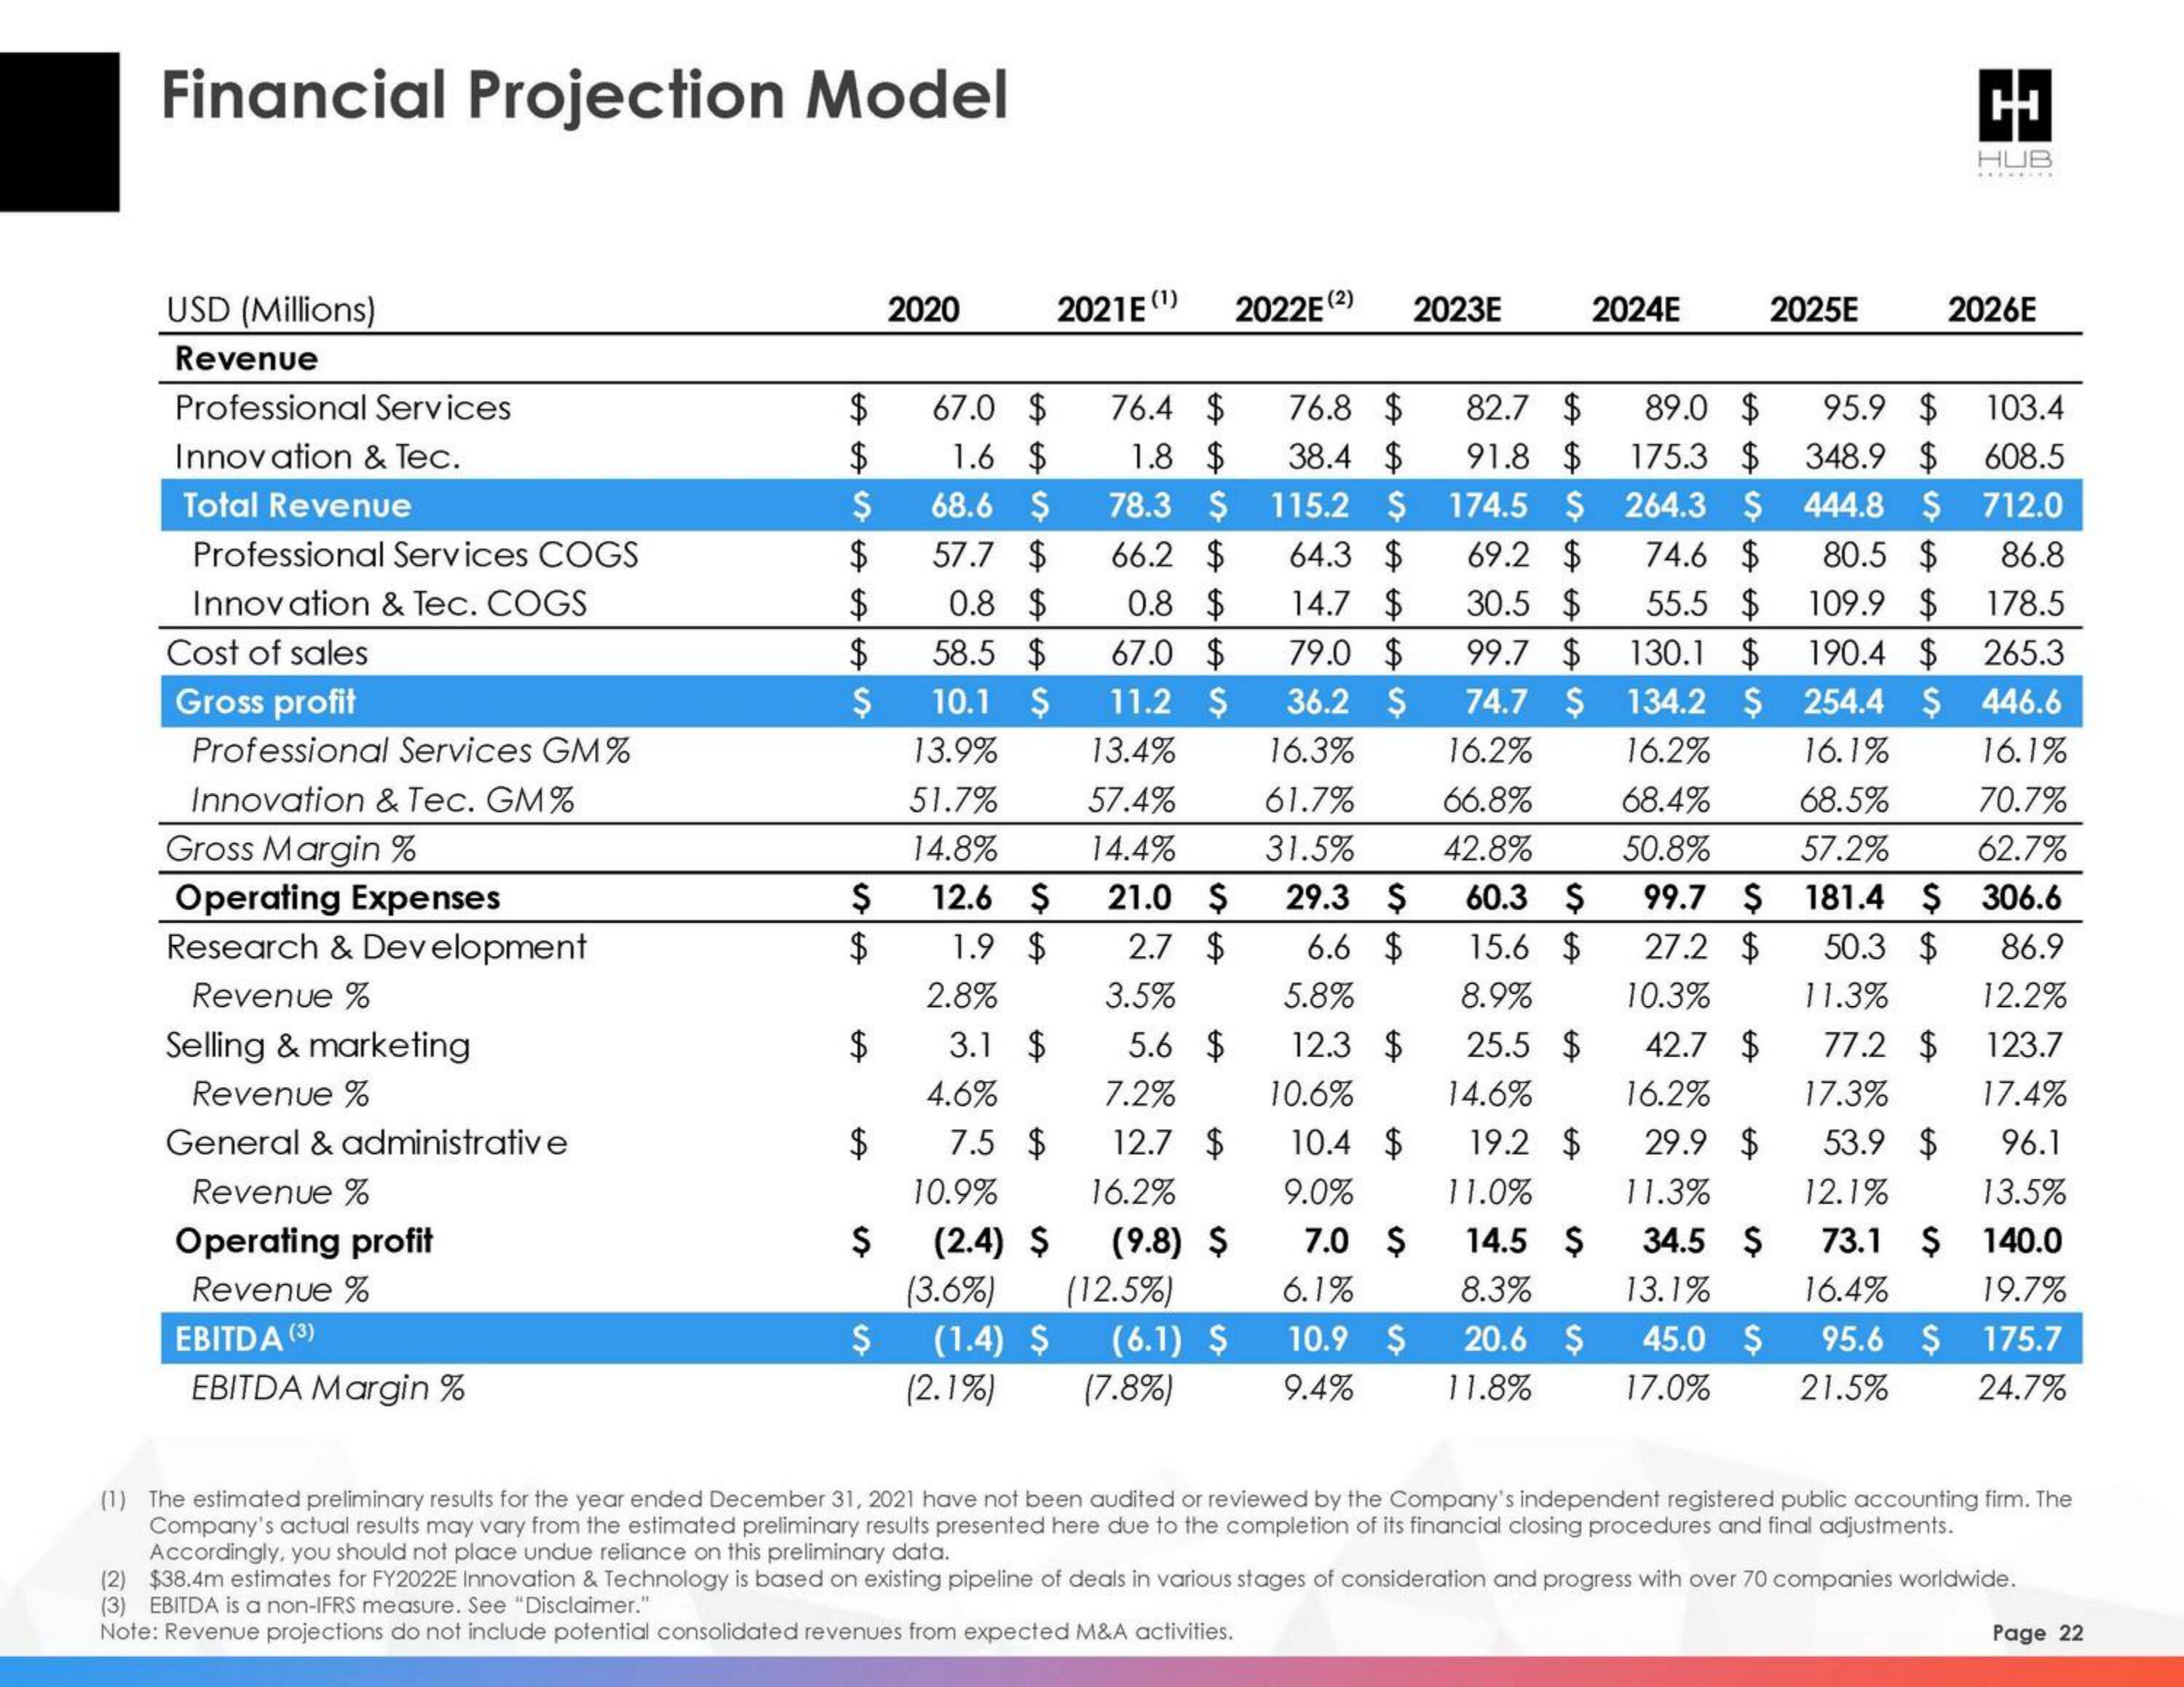
(1) The estimated preliminary results for the year ended December 31, 2021 have not been audited or reviewed by the Company's independent registered public accounting firm. The
Company's actual results may vary from the estimated preliminary results presented here due to the completion of its financial closing procedures and final adjustments.
Accordingly, you should not place undue reliance on this preliminary data.
(2) $38.4m estimates for FY2022E Innovation & Technology is based on existing pipeline of deals in various stages of consideration and progress with over 70 companies worldwide.
(3) EBITDA is a non-IFRS measure. See "Disclaimer."
Note: Revenue projections do not include potential consolidated revenues from expected M&A activities.
Page 22View entire presentation