Paysafe SPAC Presentation Deck
KPI's
Organic
Revenue Mix
2021E financial metrics
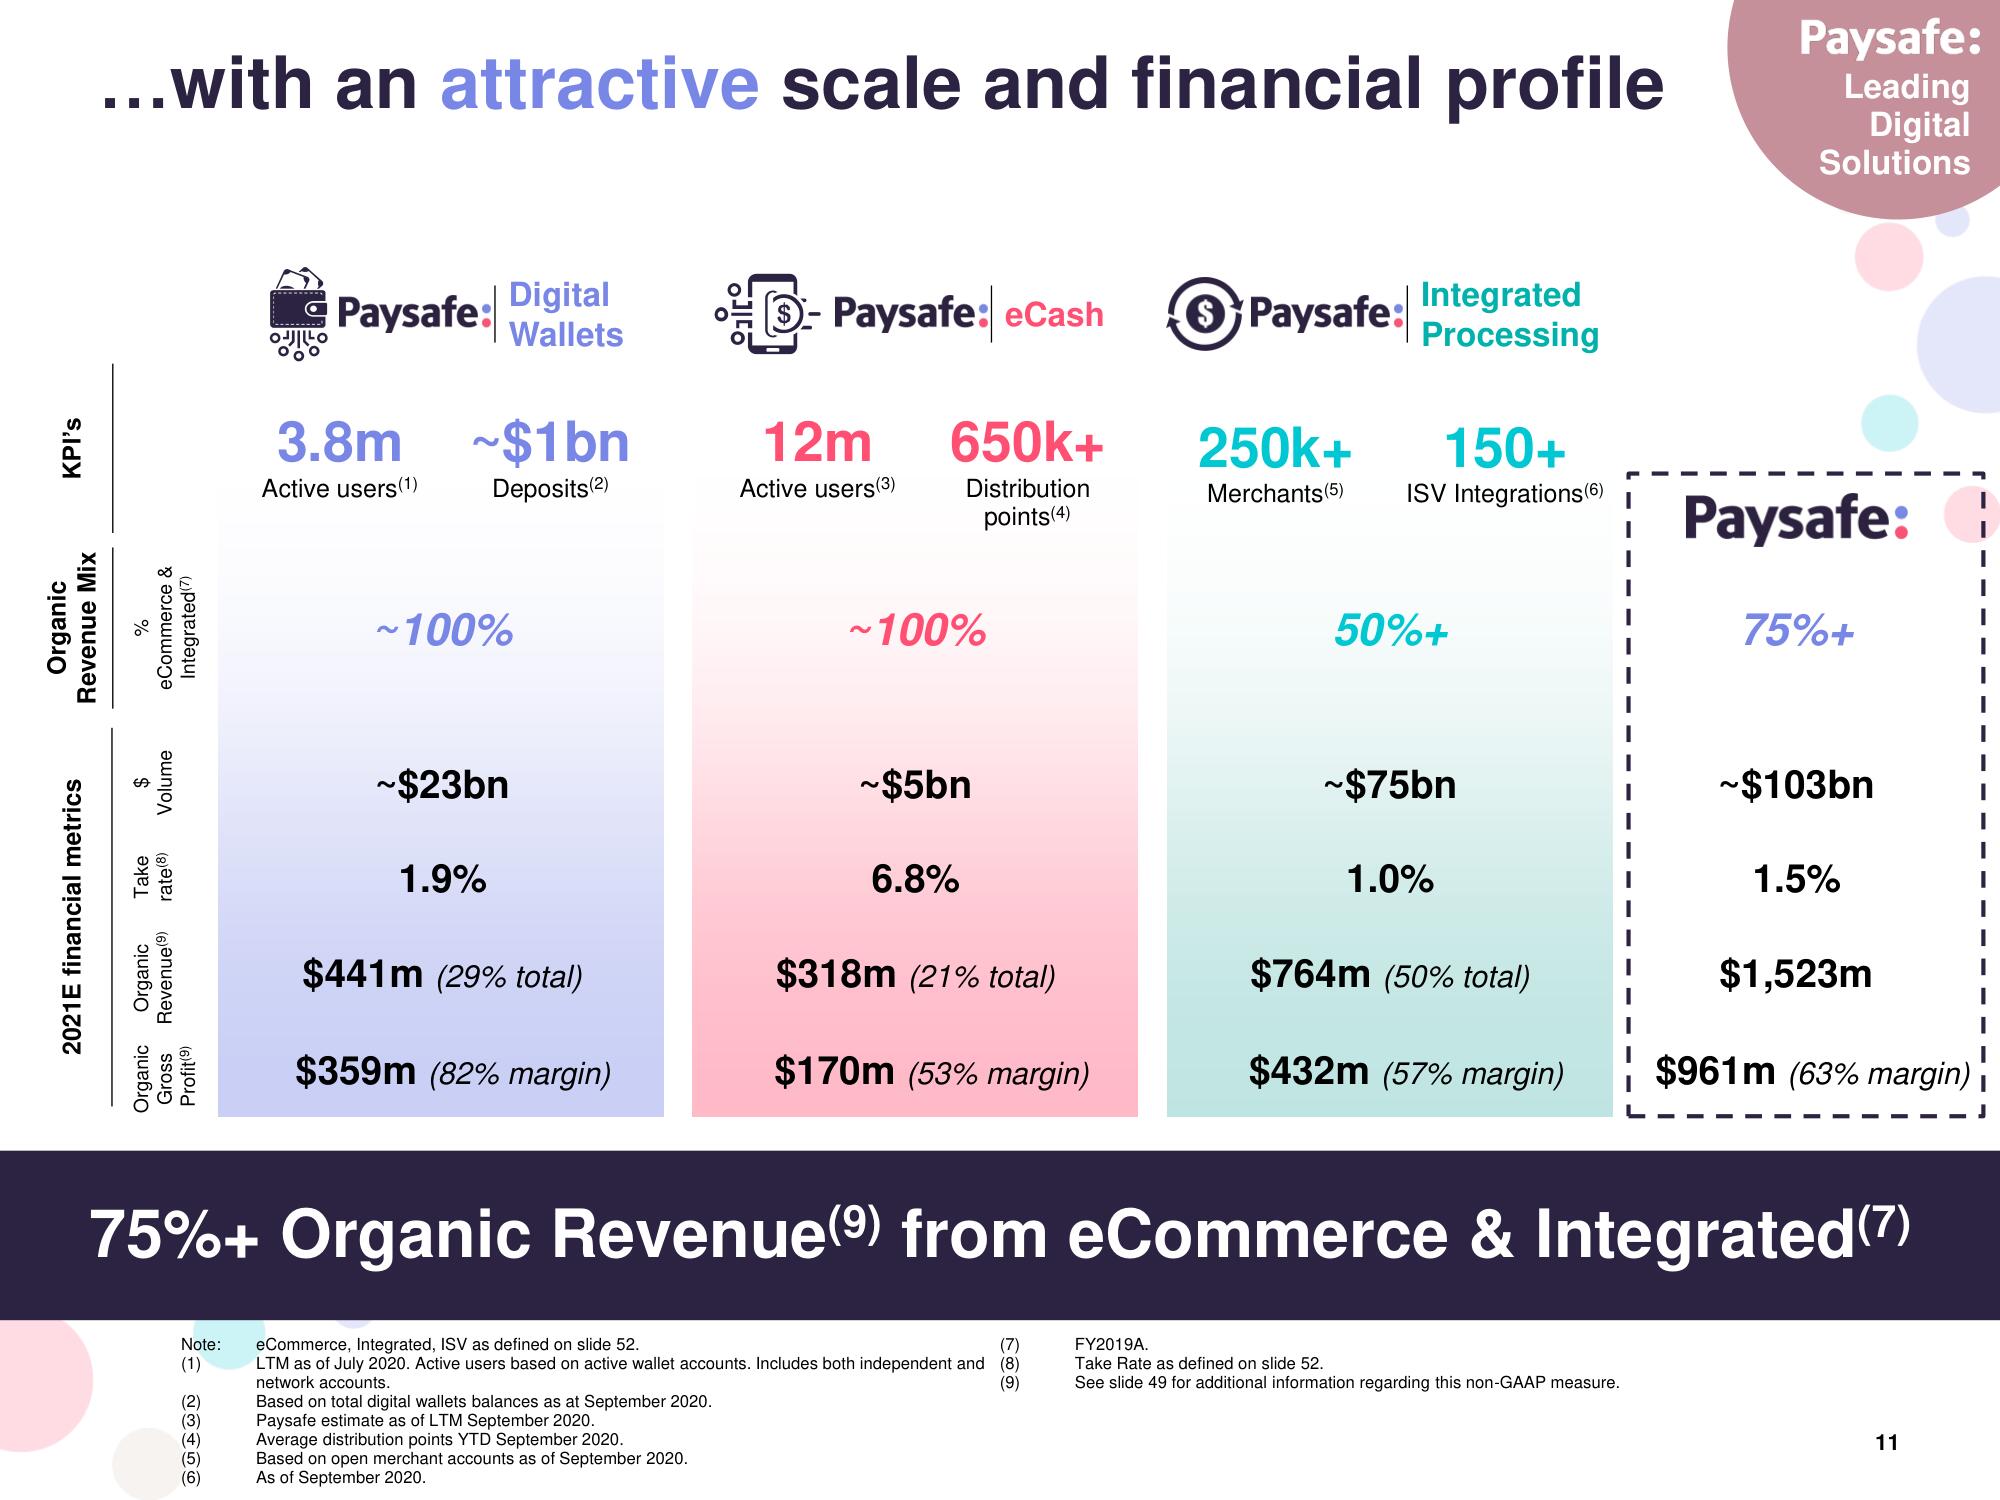
...with an attractive scale and financial profile
%
eCommerce &
Integrated (7)
$
Volume
Take
rate (8)
Organic Organic
Gross Revenue (⁹)
Profit(⁹)
Paysafe:
(6)
3.8m ~$1bn
Active users(1)
Deposits (2)
Digital
Wallets
~100%
~$23bn
1.9%
$441m (29% total)
$359m (82% margin)
- Paysafe: eCash
Based on total digital wallets balances as at September 2020.
Paysafe estimate as of LTM September 2020.
Average distribution points YTD September 2020.
12m
Active users(3)
Based on open merchant accounts as of September 2020.
As of September 2020.
650k+
Distribution
points (4)
~100%
~$5bn
6.8%
$318m (21% total)
Note: eCommerce, Integrated, ISV as defined on slide 52.
(7)
(1)
LTM as of July 2020. Active users based on active wallet accounts. Includes both independent and (8)
network accounts.
(9)
(2)
$170m (53% margin)
S Paysafe:
250k+
Merchants (5)
Integrated
Processing
150+
ISV Integrations (6)
50%+
~$75bn
1.0%
$764m (50% total)
$432m (57% margin)
Paysafe:
Leading
Digital
Solutions
FY2019A.
Take Rate as defined on slide 52.
See slide 49 for additional information regarding this non-GAAP measure.
Paysafe:
75%+
75%+ Organic Revenue(9) from eCommerce & Integrated(7)
~$103bn
1.5%
$1,523m
$961m (63% margin)
11View entire presentation