FGI Industries Investor Presentation Deck
Balance Sheet & Liquidity Update
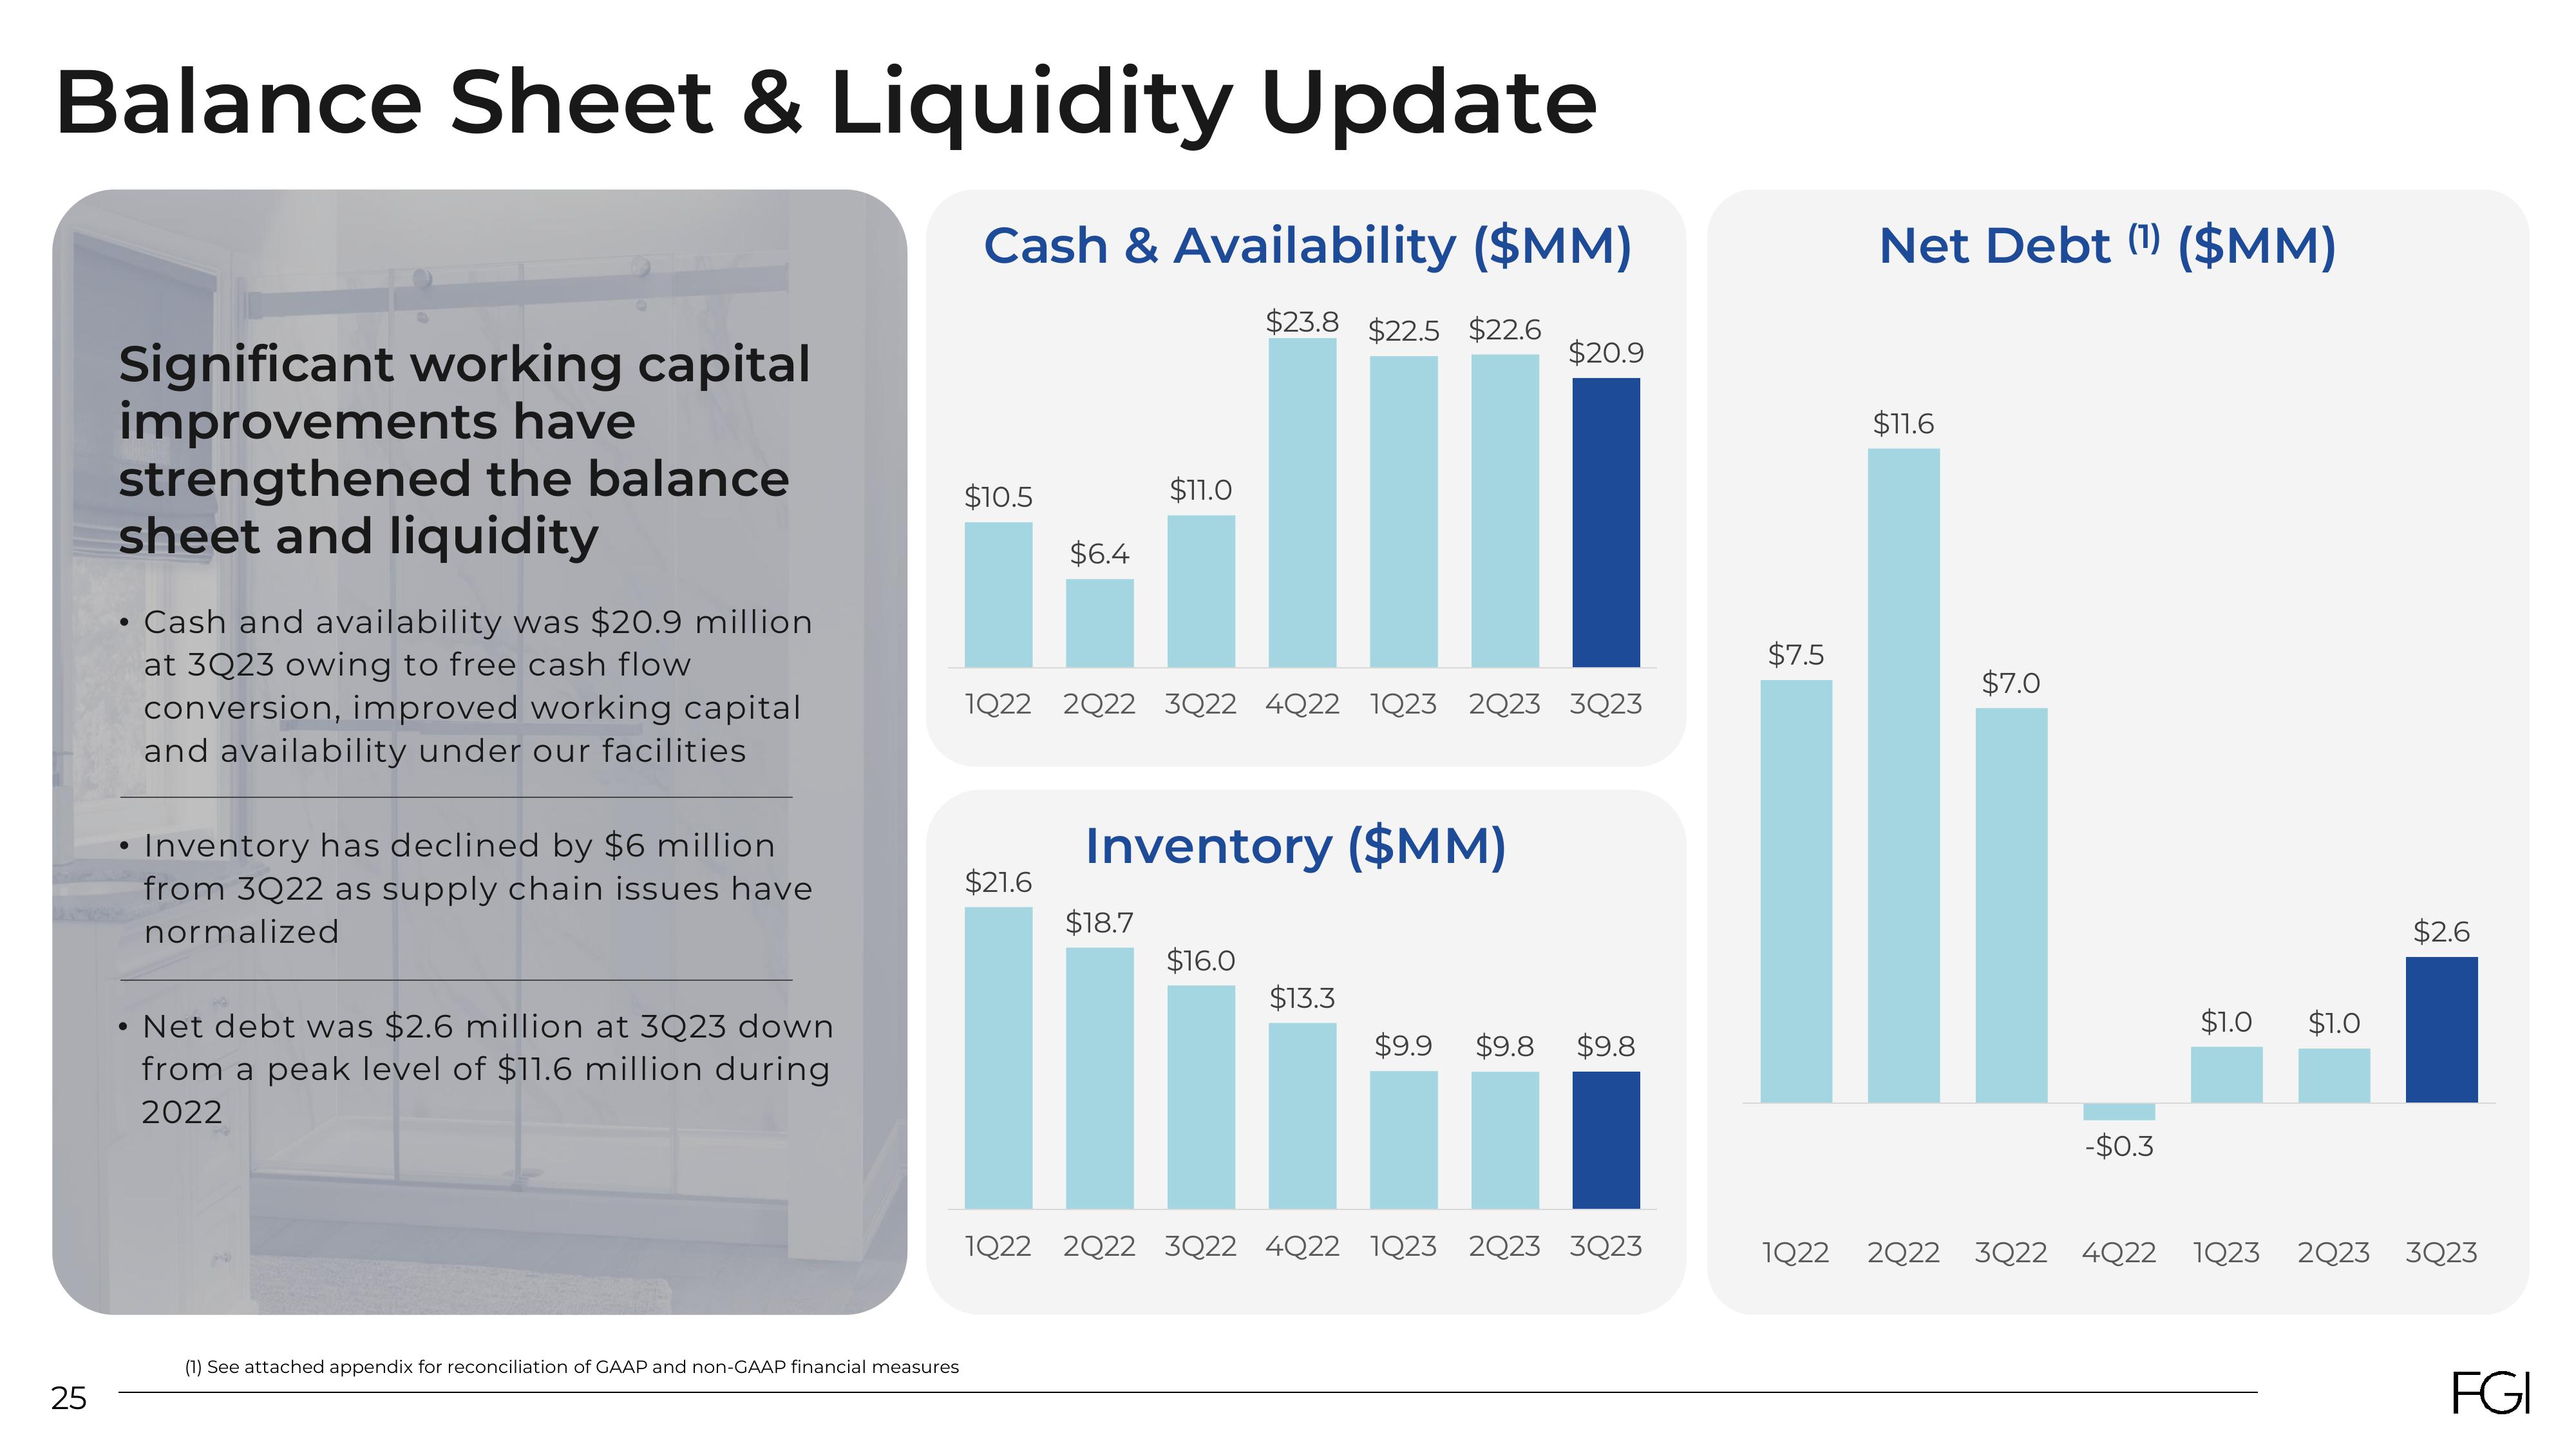
Cash & Availability ($MM)
$23.8 $22.5 $22.6
25
Significant working capital
improvements have
strengthened the balance
sheet and liquidity
• Cash and availability was $20.9 million
at 3Q23 owing to free cash flow
conversion, improved working capital
and availability under our facilities
Inventory has declined by $6 million
from 3Q22 as supply chain issues have
normalized
• Net debt was $2.6 million at 3Q23 down
from a peak level of $11.6 million during
2022
(1) See attached appendix for reconciliation of GAAP and non-GAAP financial measures
$10.5
$6.4
$21.6
$11.0
1Q22 2Q22 3Q22 4Q22 1Q23 2Q23 3Q23
Inventory ($MM)
$18.7
$16.0
$20.9
$13.3
$9.9 $9.8 $9.8
1Q22 2Q22 3Q22 4Q22 1Q23 2Q23 3Q23
$7.5
Net Debt (¹) ($MM)
$11.6
$7.0
-$0.3
1Q22 2Q22 3Q22 4Q22
$1.0
$1.0
$2.6
1Q23 2Q23 3Q23
FGIView entire presentation