Truist Financial Corp Results Presentation Deck
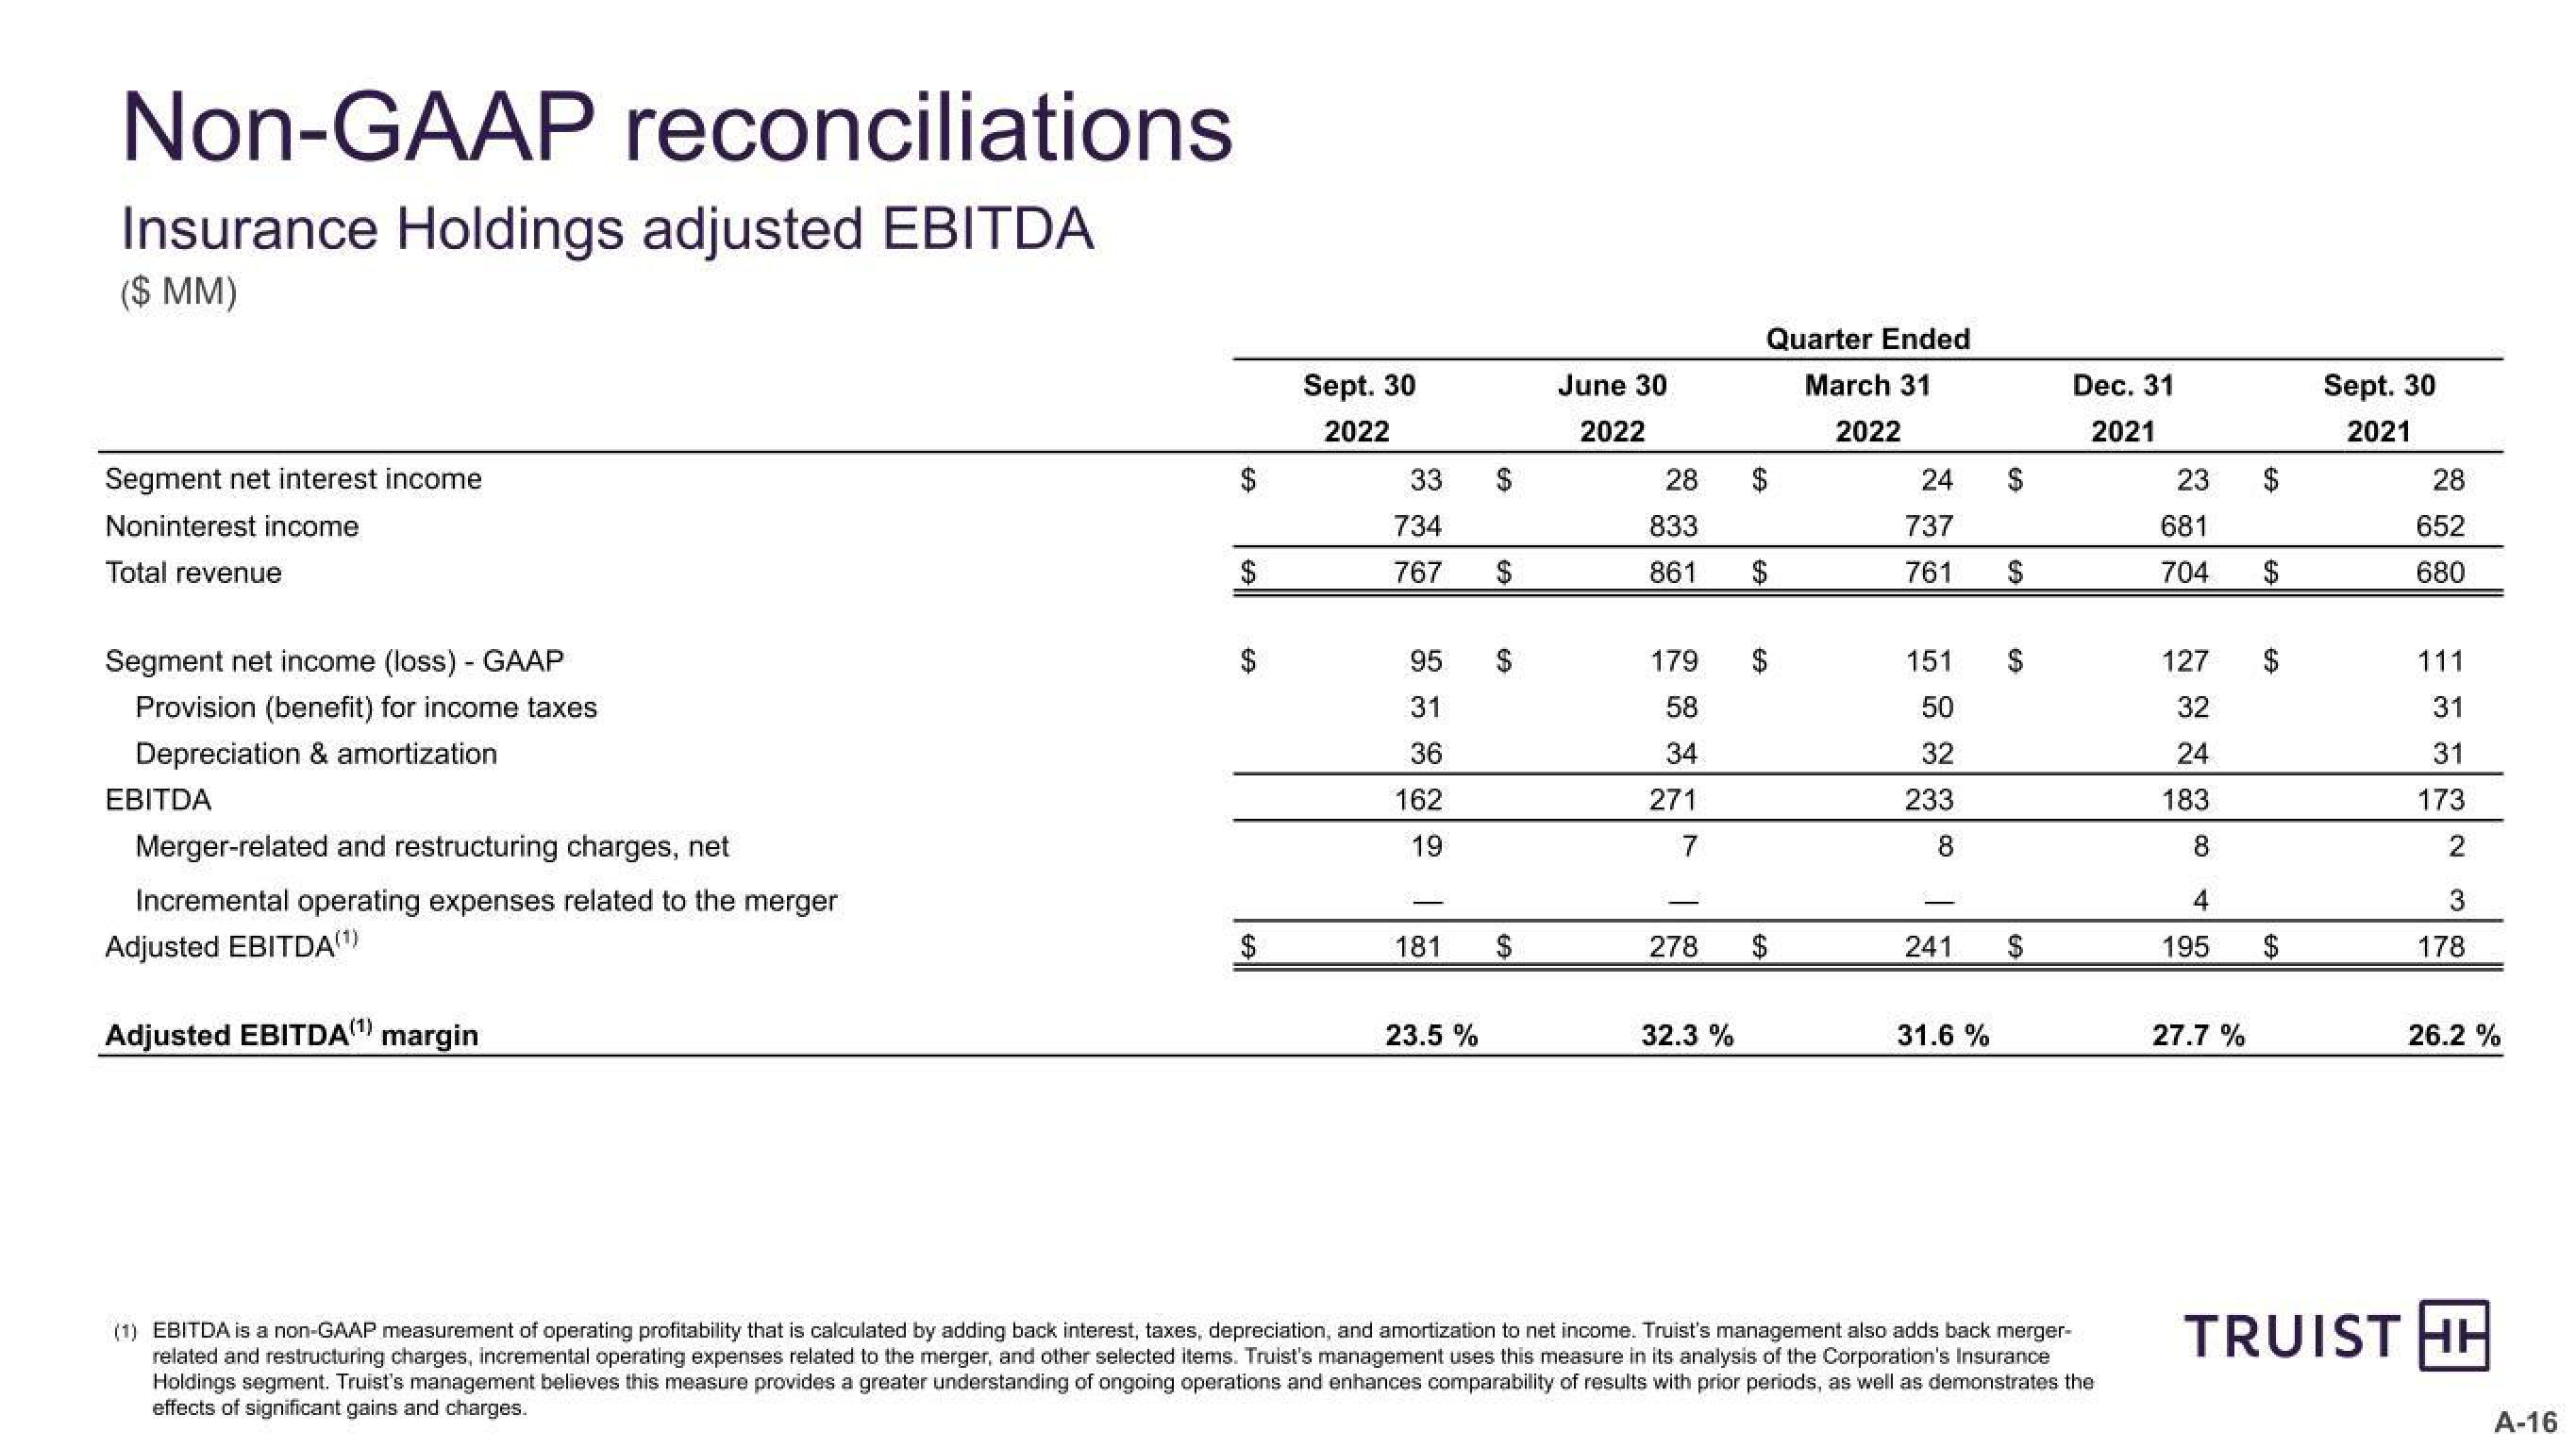
Non-GAAP reconciliations
Insurance Holdings adjusted EBITDA
($ MM)
Segment net interest income
Noninterest income
Total revenue
Segment net income (loss) - GAAP
Provision (benefit) for income taxes
Depreciation & amortization
EBITDA
Merger-related and restructuring charges, net
Incremental operating expenses related to the merger
Adjusted EBITDA(¹)
Adjusted EBITDA(¹) margin
$
EA
$
Sept. 30
2022
33
734
767
95
31
36
162
19
181
23.5 %
$
$
$
$
June 30
2022
28
833
861
179
58
34
271
7
278
32.3 %
Quarter Ended
March 31
2022
$
69
24
737
761
151
50
32
233
8
241
31.6%
$
$
Dec. 31
2021
(1) EBITDA is a non-GAAP measurement of operating profitability that is calculated by adding back interest, taxes, depreciation, and amortization to net income. Truist's management also adds back merger-
related and restructuring charges, incremental operating expenses related to the merger, and other selected items. Truist's management uses this measure in its analysis of the Corporation's Insurance
Holdings segment. Truist's management believes this measure provides a greater understanding of ongoing operations and enhances comparability of results with prior periods, as well as demonstrates the
effects of significant gains and charges.
23
681
704
127
32
24
183
8
4
195
27.7 %
$
$
Sept. 30
2021
28
652
680
111
31
31
173
2
3
178
26.2 %
TRUIST HH
A-16View entire presentation