AMD Results Presentation Deck
30
APPENDICES
Share Count Overview
Shares (millions)
(1)
Basic Shares
Dilutive impacts from:
Employee Equity Grants (2)
Xilinx Assumed Awards
Diluted Shares
Q4'21
Actual
Q1 2022 FINANCIAL RESULTS | MAY 3, 2022
1,208
14
1,222
Q1'22
Q2'22
2022
Actual Estimate Estimate
1,393
1,622
1,568
13
4
1,410
13
6
1,641
12
4
1,584
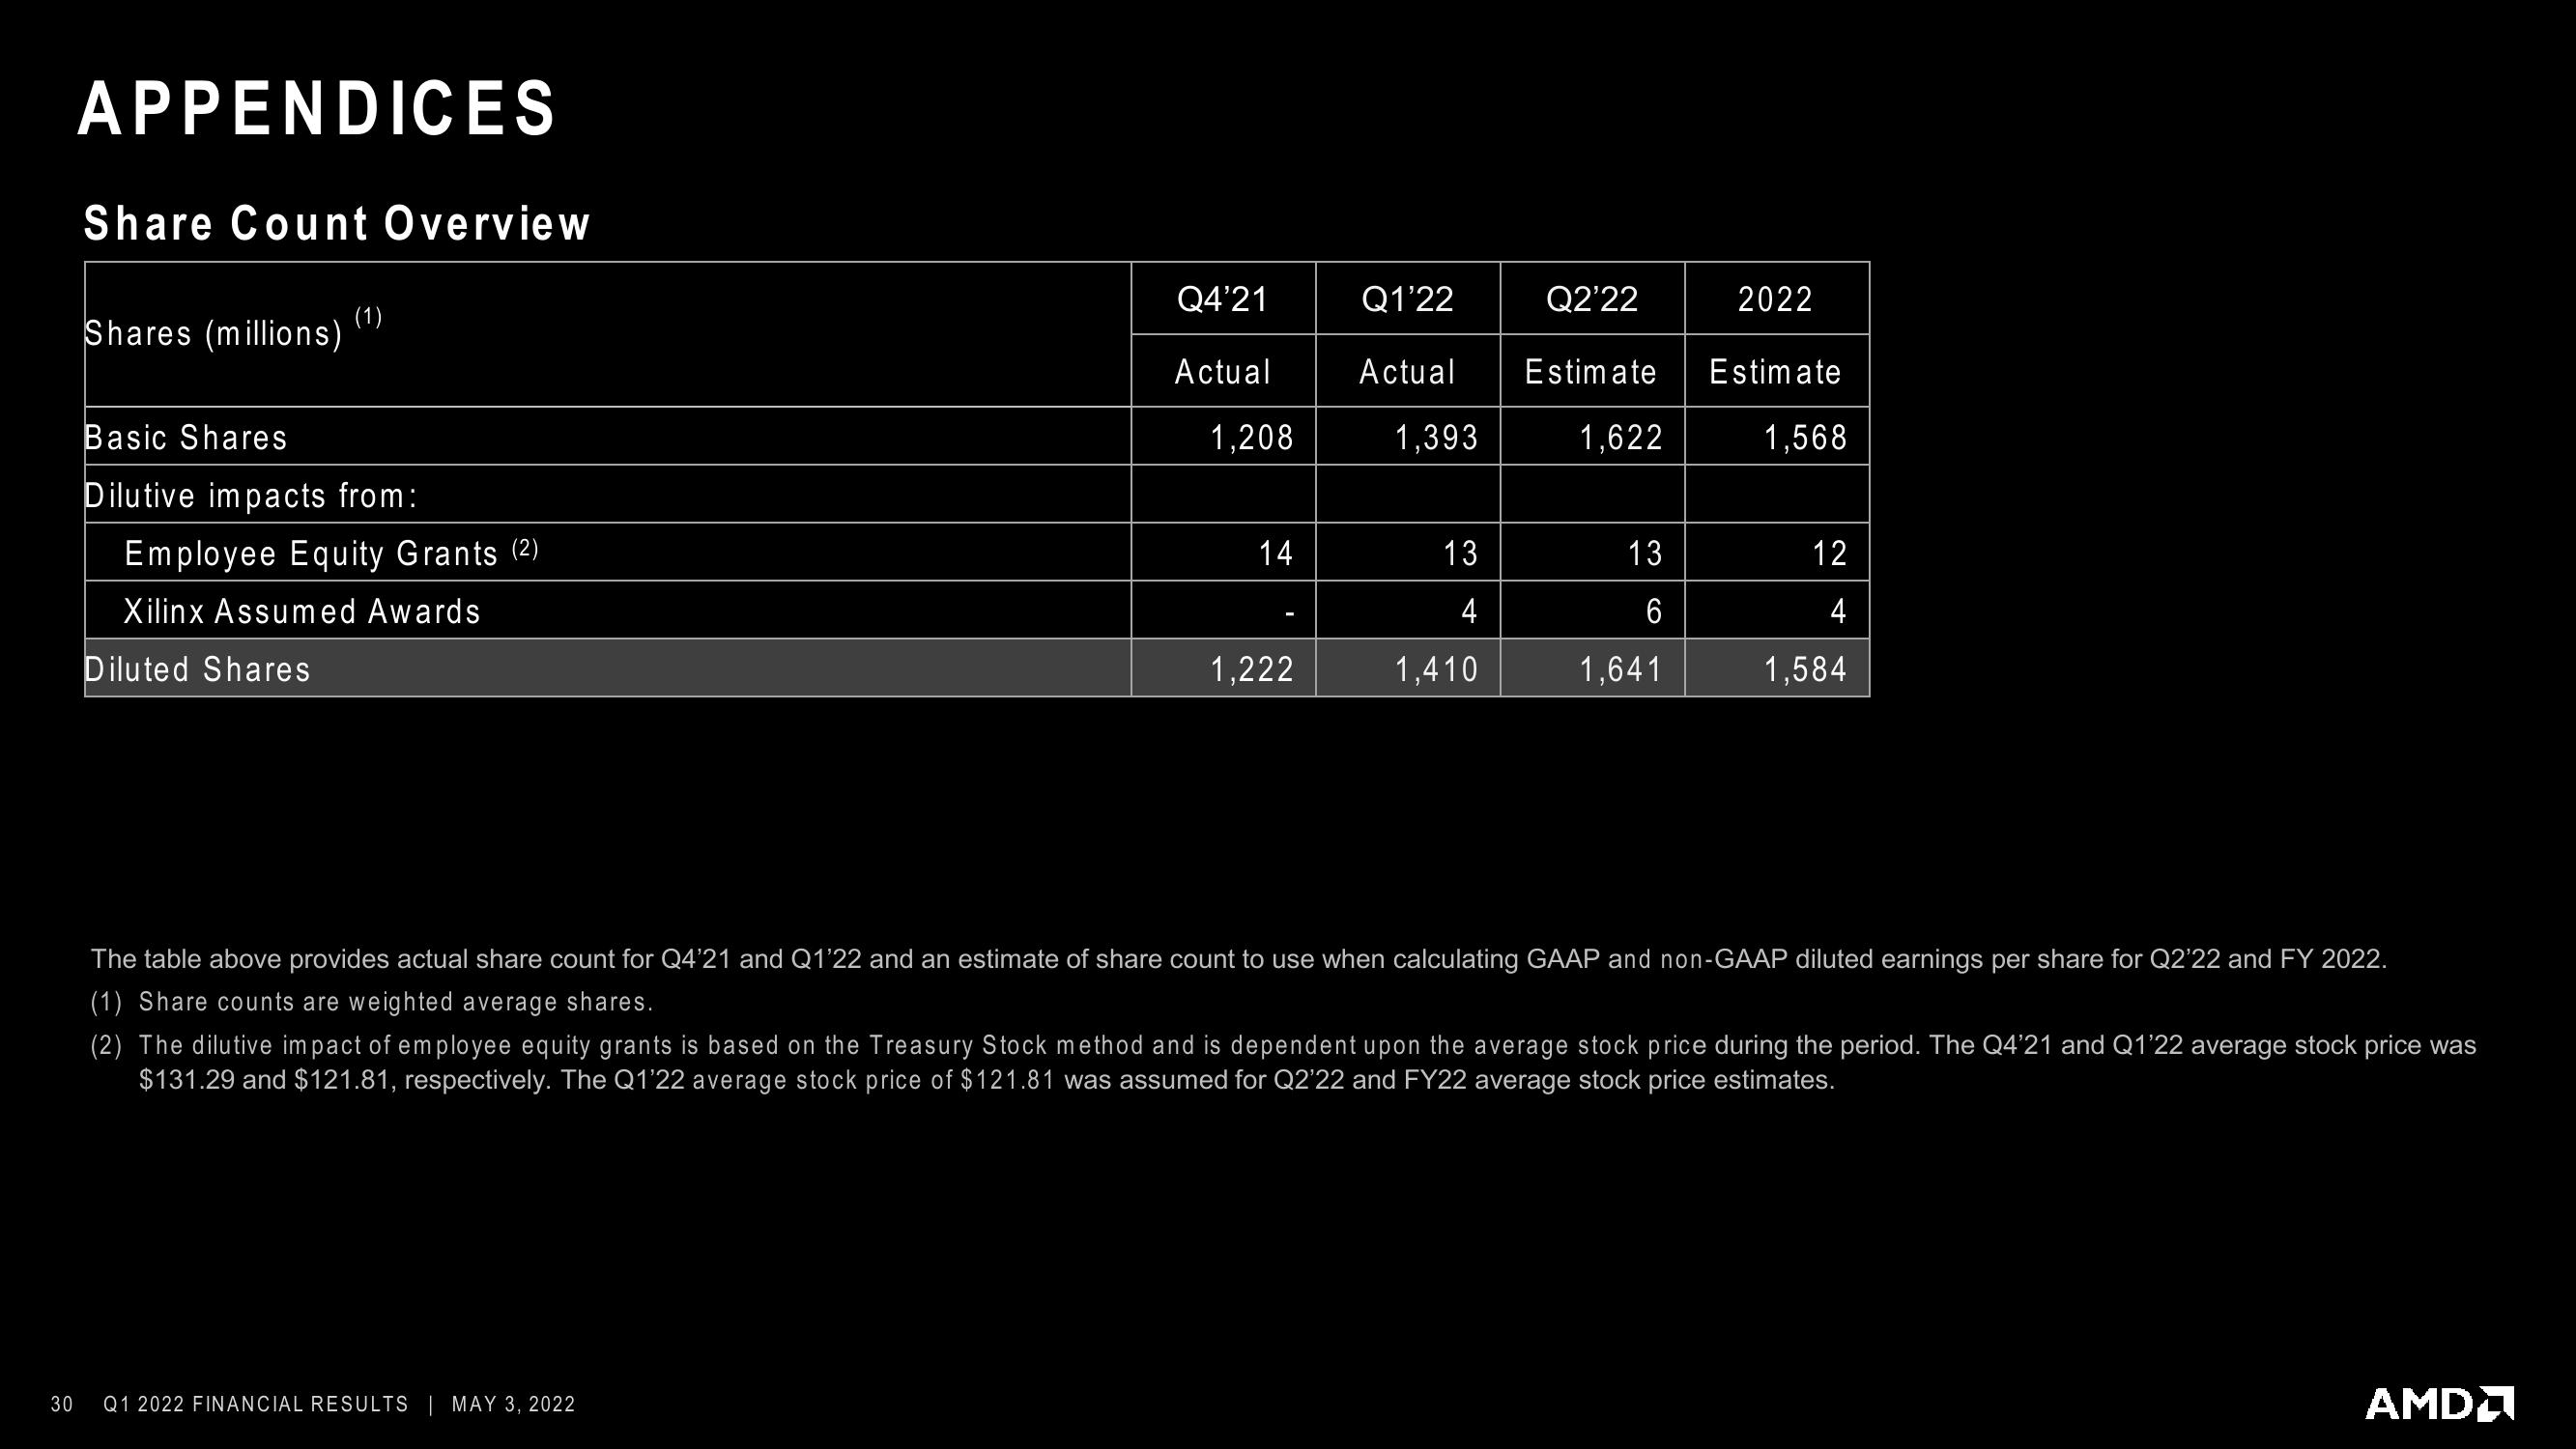
The table above provides actual share count for Q4'21 and Q1'22 and an estimate of share count to use when calculating GAAP and non-GAAP diluted earnings per share for Q2'22 and FY 2022.
(1) Share counts are weighted average shares.
(2) The dilutive impact of employee equity grants is based on the Treasury Stock method and is dependent upon the average stock price during the period. The Q4'21 and Q1'22 average stock price was
$131.29 and $121.81, respectively. The Q1'22 average stock price of $121.81 was assumed for Q2'22 and FY22 average stock price estimates.
AMDView entire presentation