Vivid Seats Results Presentation Deck
Full Year 2021 Financial Highlights
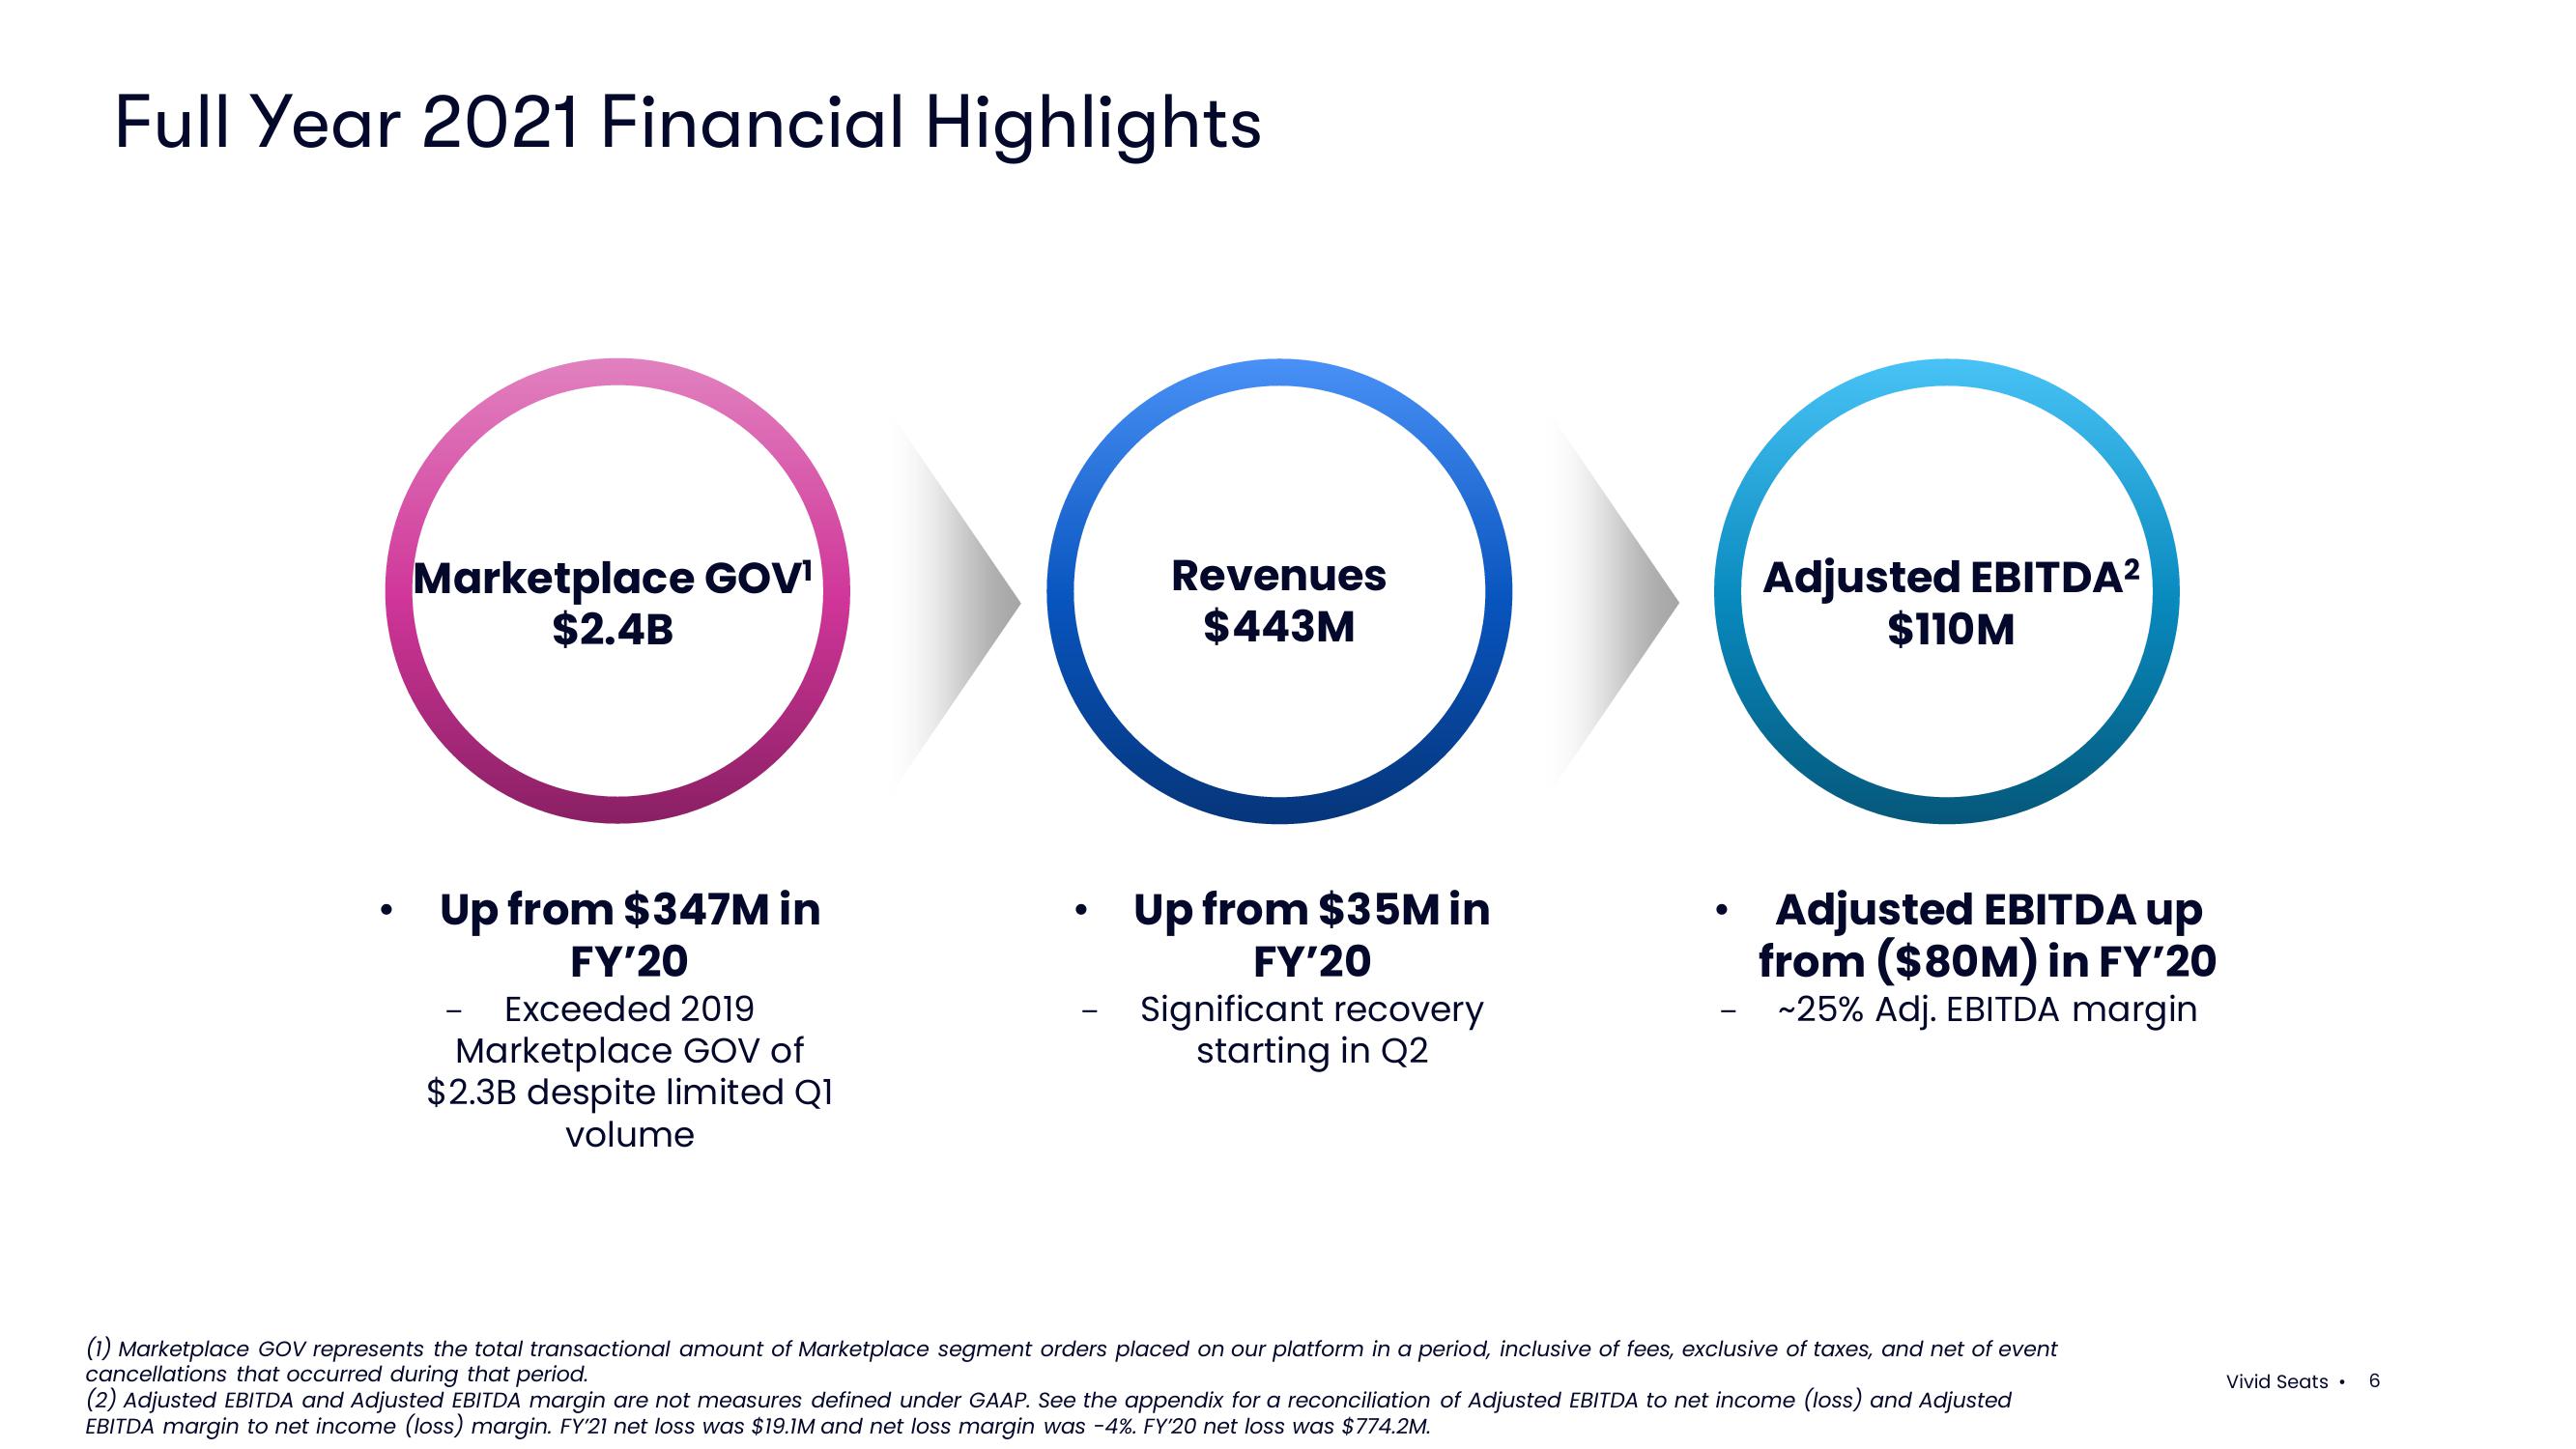
Marketplace GOV¹
$2.4B
Up from $347M in
FY'20
Exceeded 2019
Marketplace GOV of
$2.3B despite limited Q1
volume
●
Revenues
$443M
Up from $35M in
FY'20
Significant recovery
starting in Q2
●
Adjusted EBITDA²
$110M
Adjusted EBITDA up
from ($80M) in FY'20
~25% Adj. EBITDA margin
(1) Marketplace GOV represents the total transactional amount of Marketplace segment orders placed on our platform in a period, inclusive of fees, exclusive of taxes, and net of event
cancellations that occurred during that period.
(2) Adjusted EBITDA and Adjusted EBITDA margin are not measures defined under GAAP. See the appendix for a reconciliation of Adjusted EBITDA to net income (loss) and Adjusted
EBITDA margin to net income (loss) margin. FY'21 net loss was $19.1M and net loss margin was -4%. FY'20 net loss was $774.2M.
Vivid Seats . 6View entire presentation