First-Quarter 2023 Earnings Presentation
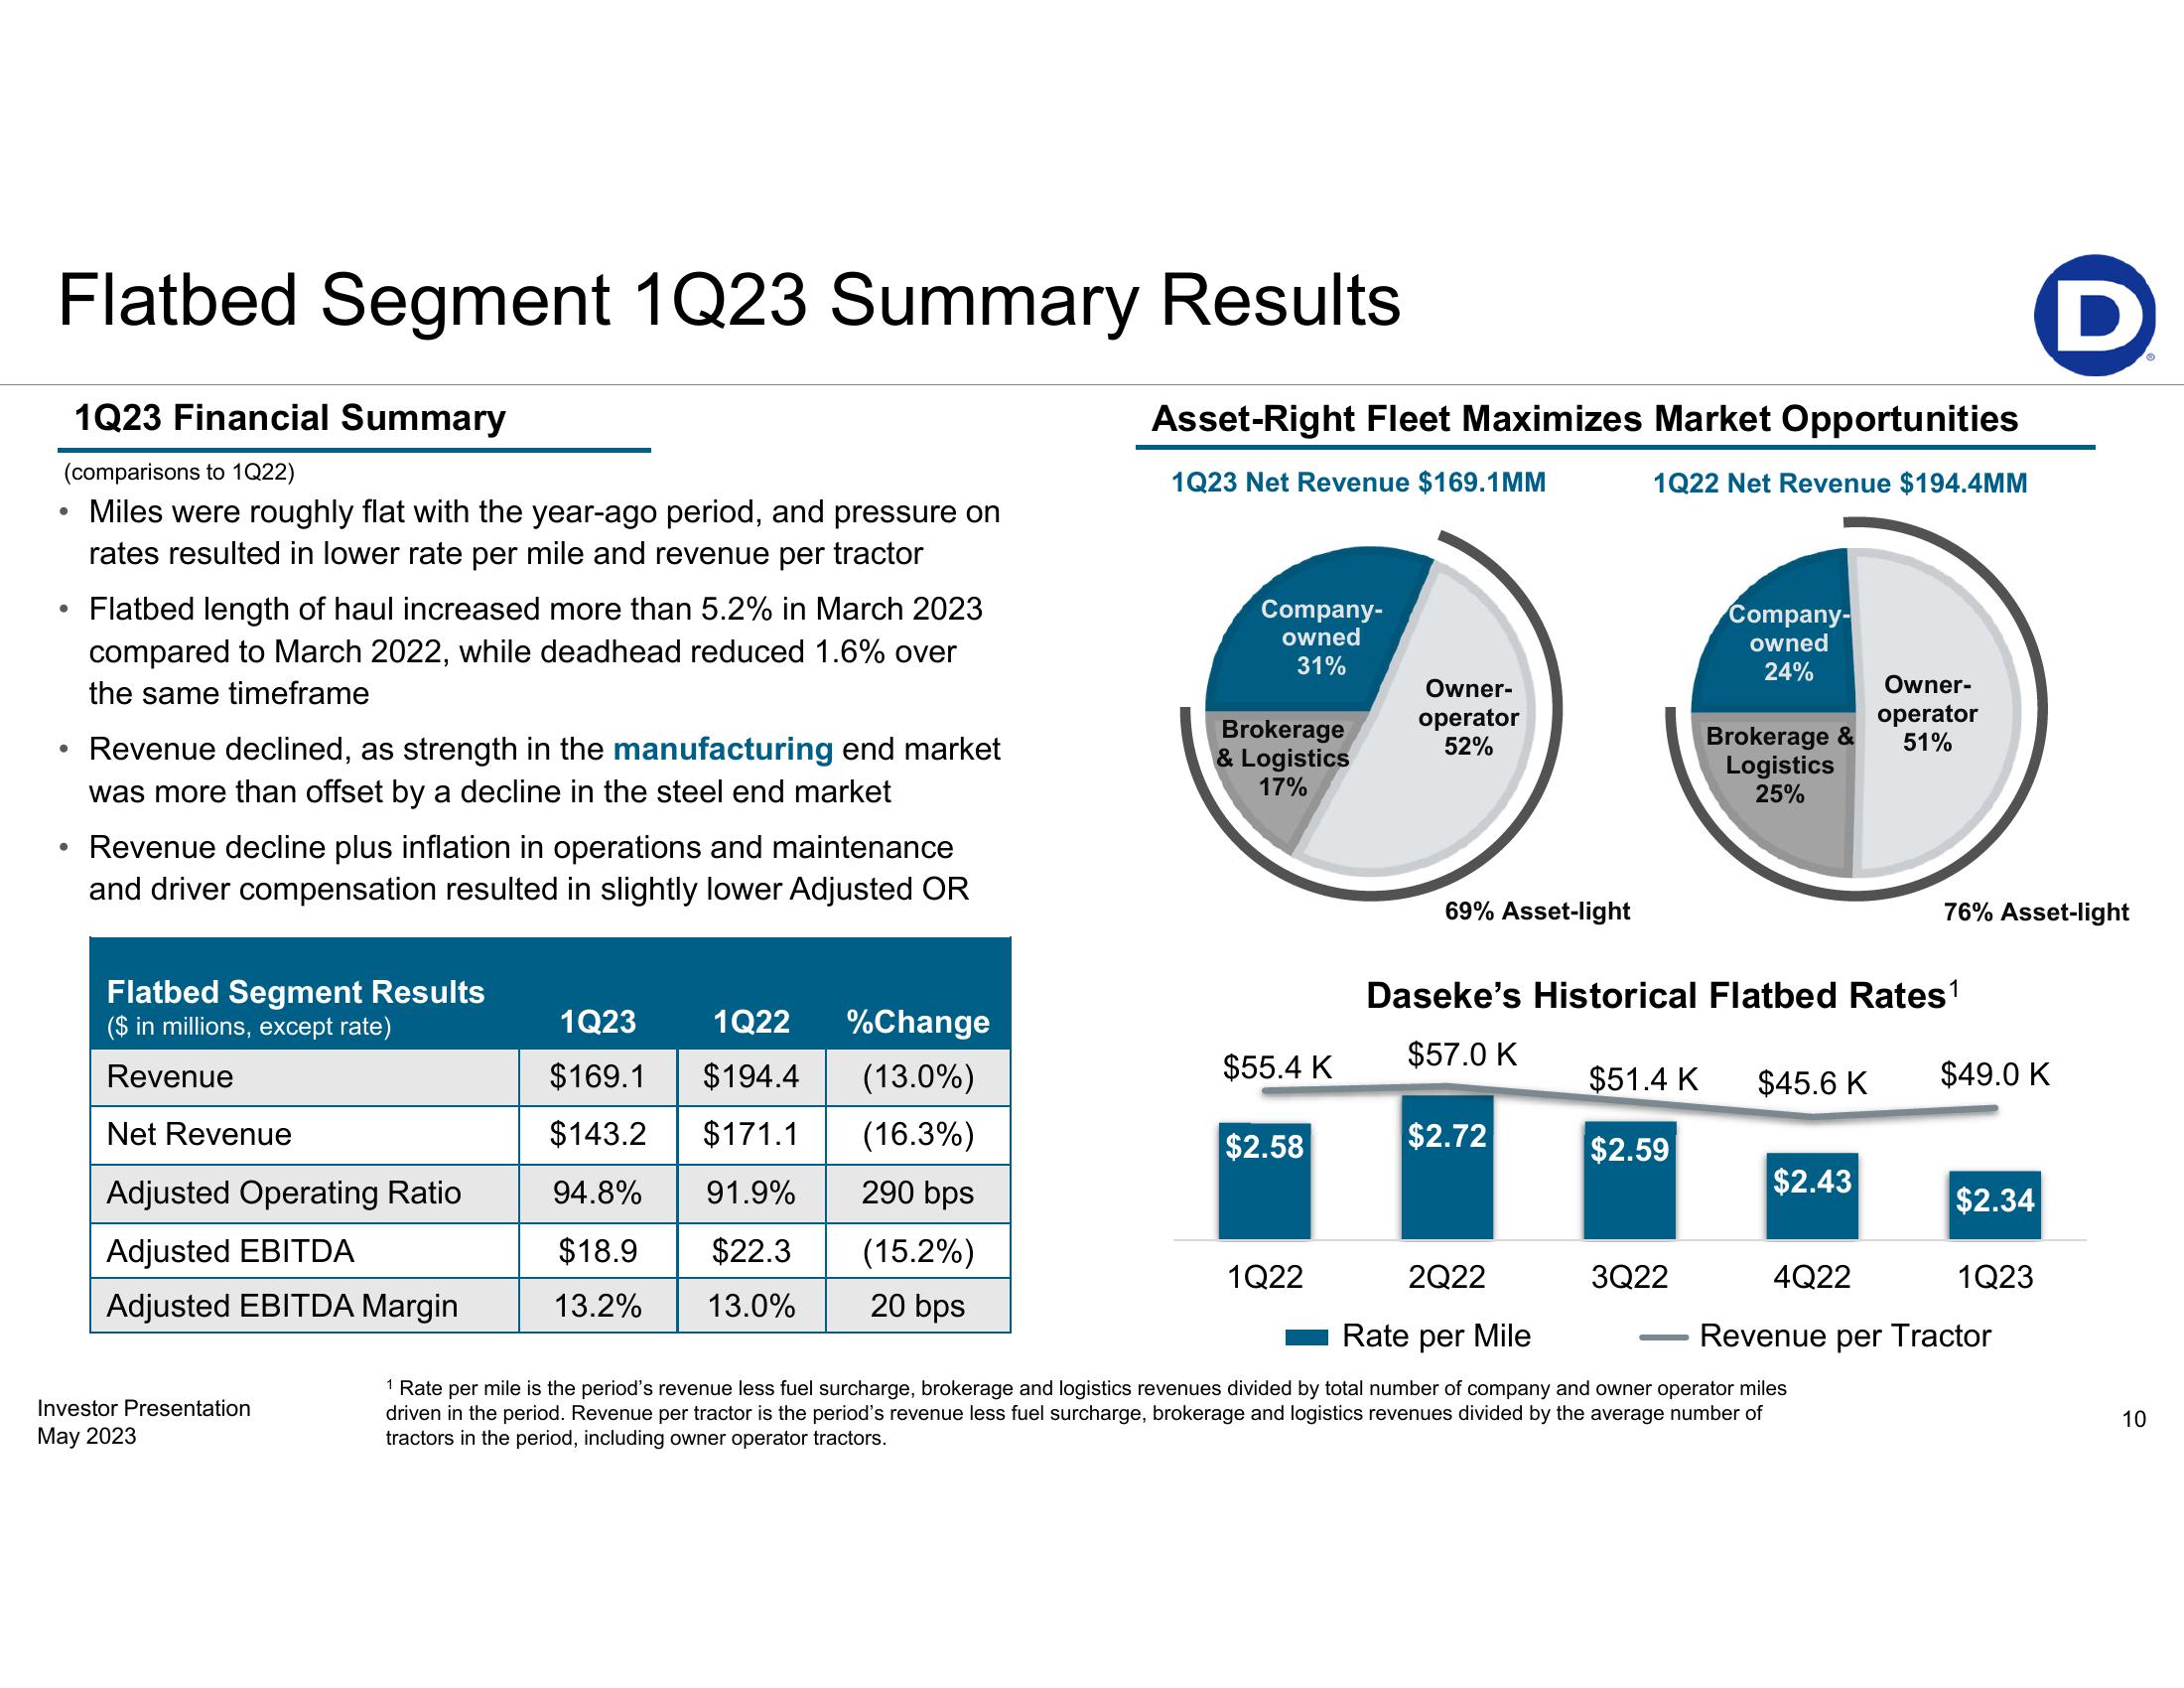
Flatbed Segment 1Q23 Summary Results
1Q23 Financial Summary
(comparisons to 1Q22)
Miles were roughly flat with the year-ago period, and pressure on
rates resulted in lower rate per mile and revenue per tractor
●
●
Flatbed length of haul increased more than 5.2% in March 2023
compared to March 2022, while deadhead reduced 1.6% over
the same timeframe
Revenue declined, as strength in the manufacturing end market
was more than offset by a decline in the steel end market
Revenue decline plus inflation in operations and maintenance
and driver compensation resulted in slightly lower Adjusted OR
Flatbed Segment Results
($ in millions, except rate)
Revenue
Net Revenue
Adjusted Operating Ratio
Adjusted EBITDA
Adjusted EBITDA Margin
Investor Presentation
May 2023
1Q23 1Q22 %Change
$169.1 $194.4 (13.0%)
$143.2 $171.1 (16.3%)
94.8%
91.9%
290 bps
$18.9
$22.3
(15.2%)
13.2%
13.0%
20 bps
Asset-Right Fleet Maximizes Market Opportunities
1Q22 Net Revenue $194.4MM
1Q23 Net Revenue $169.1MM
Company-
owned
31%
Brokerage
& Logistics
17%
$55.4 K
$2.58
1Q22
Owner-
operator
52%
69% Asset-light
$2.72
$51.4 K
$2.59
Company-
owned
24%
3Q22
Brokerage &
Logistics
25%
Daseke's Historical Flatbed Rates ¹
$57.0 K
2Q22
Rate per Mile
1 Rate per mile is the period's revenue less fuel surcharge, brokerage and logistics revenues divided by total number of company and owner operator miles
driven in the period. Revenue per tractor is the period's revenue less fuel surcharge, brokerage and logistics revenues divided by the average number of
tractors in the period, including owner operator tractors.
$2.43
Owner-
operator
51%
$45.6 K $49.0 K
4Q22
76% Asset-light
$2.34
D
1Q23
Revenue per Tractor
10View entire presentation