Zegna SPAC Presentation Deck
5. Transaction structure and valuation
OPERATIONAL BENCHMARKING
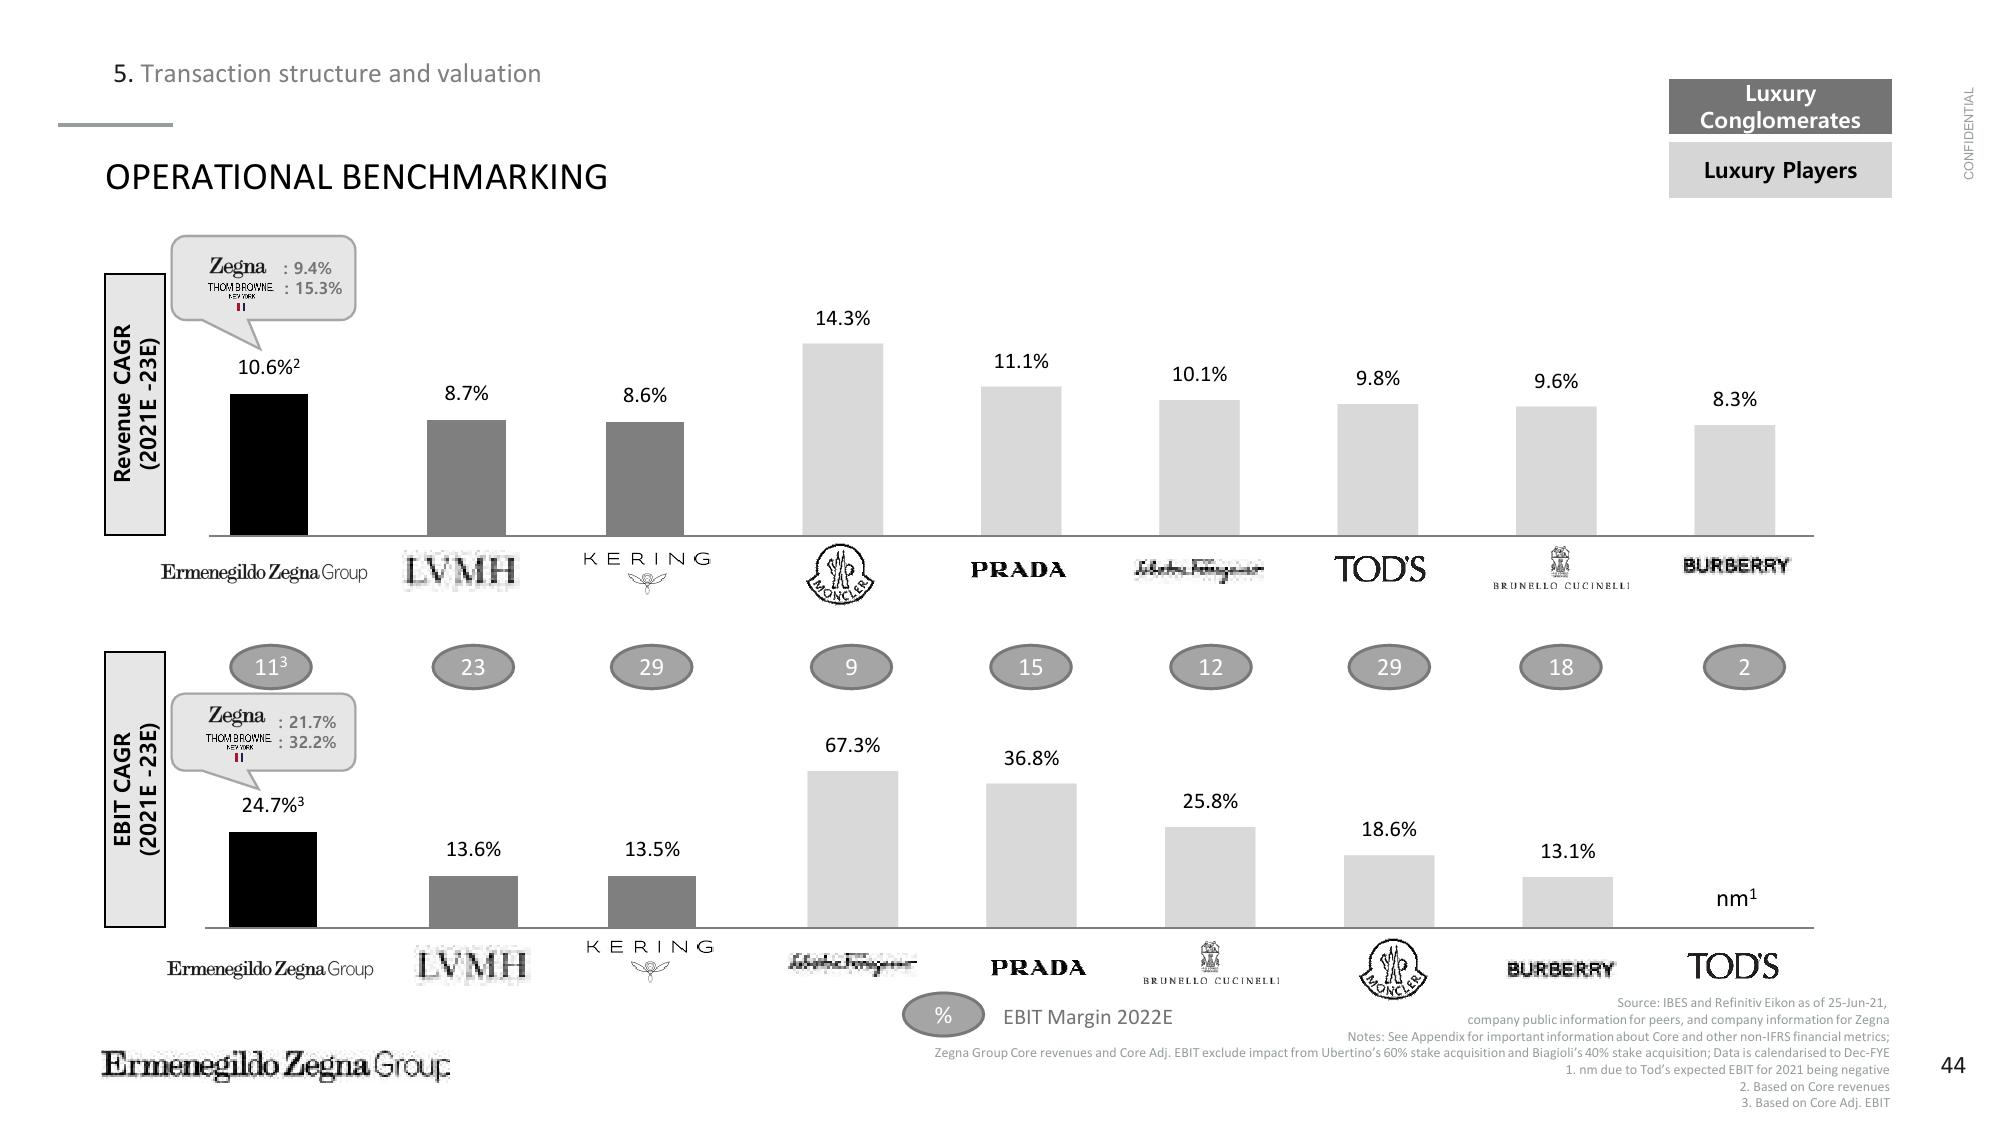
Revenue CAGR
(2021E -23E)
EBIT CAGR
(2021E-23E)
Zegna : 9.4%
THOM BROWNE 15.3%
KEY YORK
II
10.6%²
Ermenegildo Zegna Group
11³
Zegna: 21.7%
THOM BROWNE: 32.2%
II
24.7%³
Ermenegildo Zegna Group
8.7%
LVMH
23
13.6%
LVMH
Ermenegildo Zegna Group
8.6%
KERING
29
13.5%
KERING
DO
14.3%
9
67.3%
11.1%
PRADA
15
36.8%
10.1%
PRADA
12
25.8%
9.8%
BRUNELLO CUCINELLI
TOD'S
29
18.6%
9.6%
BRUNELLO CUCINELLI
18
13.1%
Luxury
Conglomerates
BURBERRY
Luxury Players
8.3%
BURBERRY
TOD'S
Source: IBES and Refinitiv Eikon as of 25-Jun-21,
%
EBIT Margin 2022E
company public information for peers, and company information for Zegna
Notes: See Appendix for important information about Core and other non-IFRS financial metrics;
Zegna Group Core revenues and Core Adj. EBIT exclude impact from Ubertino's 60% stake acquisition and Biagioli's 40% stake acquisition; Data is calendarised to Dec-FYE
1. nm due to Tod's expected EBIT for 2021 being negative
2. Based on Core revenues
3. Based on Core Adj. EBIT
2
nm¹
CONFIDENTIAL
44View entire presentation