Q3 Fiscal Year 2023 Financial Results
MANAGED OPEX TO REFLECT CHALLENGING GLOBAL ENVIRONMENT
Net sales
Y/Y % chg
Y/Y % chg (CC)
Gross profit
% margin
Operating expense
% of sales
Operating income
% margin
Net income
% margin
Earnings per share
Diluted shares
Q3'23
1,270
(22%)
(17%)
482
37.9%
278
21.9%
204
16.1%
185
14.6%
$1.14
163
Q3'22
1,633
(2%)
(2%)
663
40.6%
361
22.1%
302
18.5%
263
16.1%
$1.55
170
Note: Numbers in $ millions except EPS and percentages. Diluted share count in millions.
Results are non-GAAP. Comparisons are Y/Y and in US$ unless otherwise specified.
Y/Y
(22%)
(27%)
(266 bps)
(23%)
(25 bps)
(32%)
(242 bps)
(29%)
(150 bps)
(26%)
(4%)
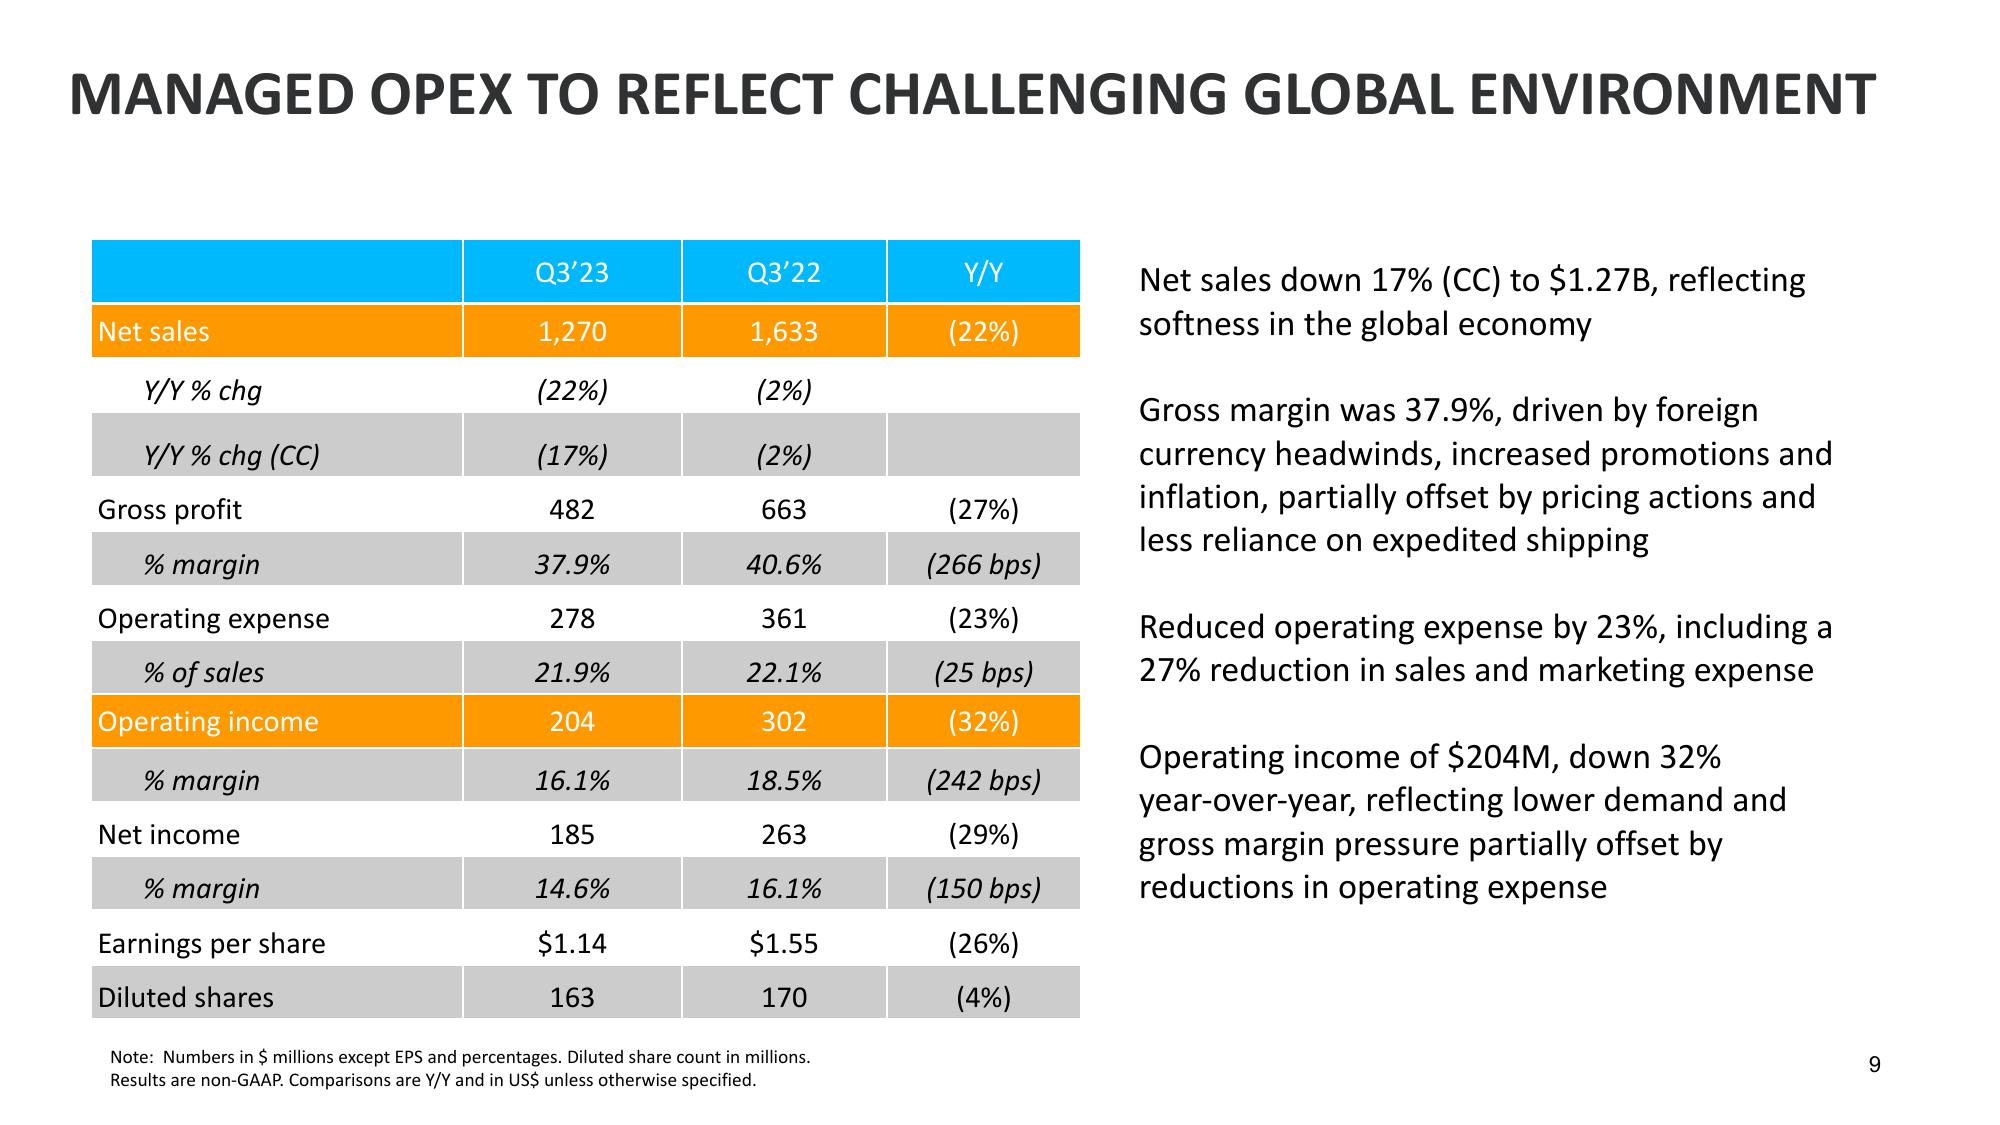
Net sales down 17% (CC) to $1.27B, reflecting
softness in the global economy
Gross margin was 37.9%, driven by foreign
currency headwinds, increased promotions and
inflation, partially offset by pricing actions and
less reliance on expedited shipping
Reduced operating expense by 23%, including a
27% reduction in sales and marketing expense
Operating income of $204M, down 32%
year-over-year, reflecting lower demand and
gross margin pressure partially offset by
reductions in operating expense
9View entire presentation