Helbiz SPAC Presentation Deck slide image

Helbiz SPAC Presentation Deck

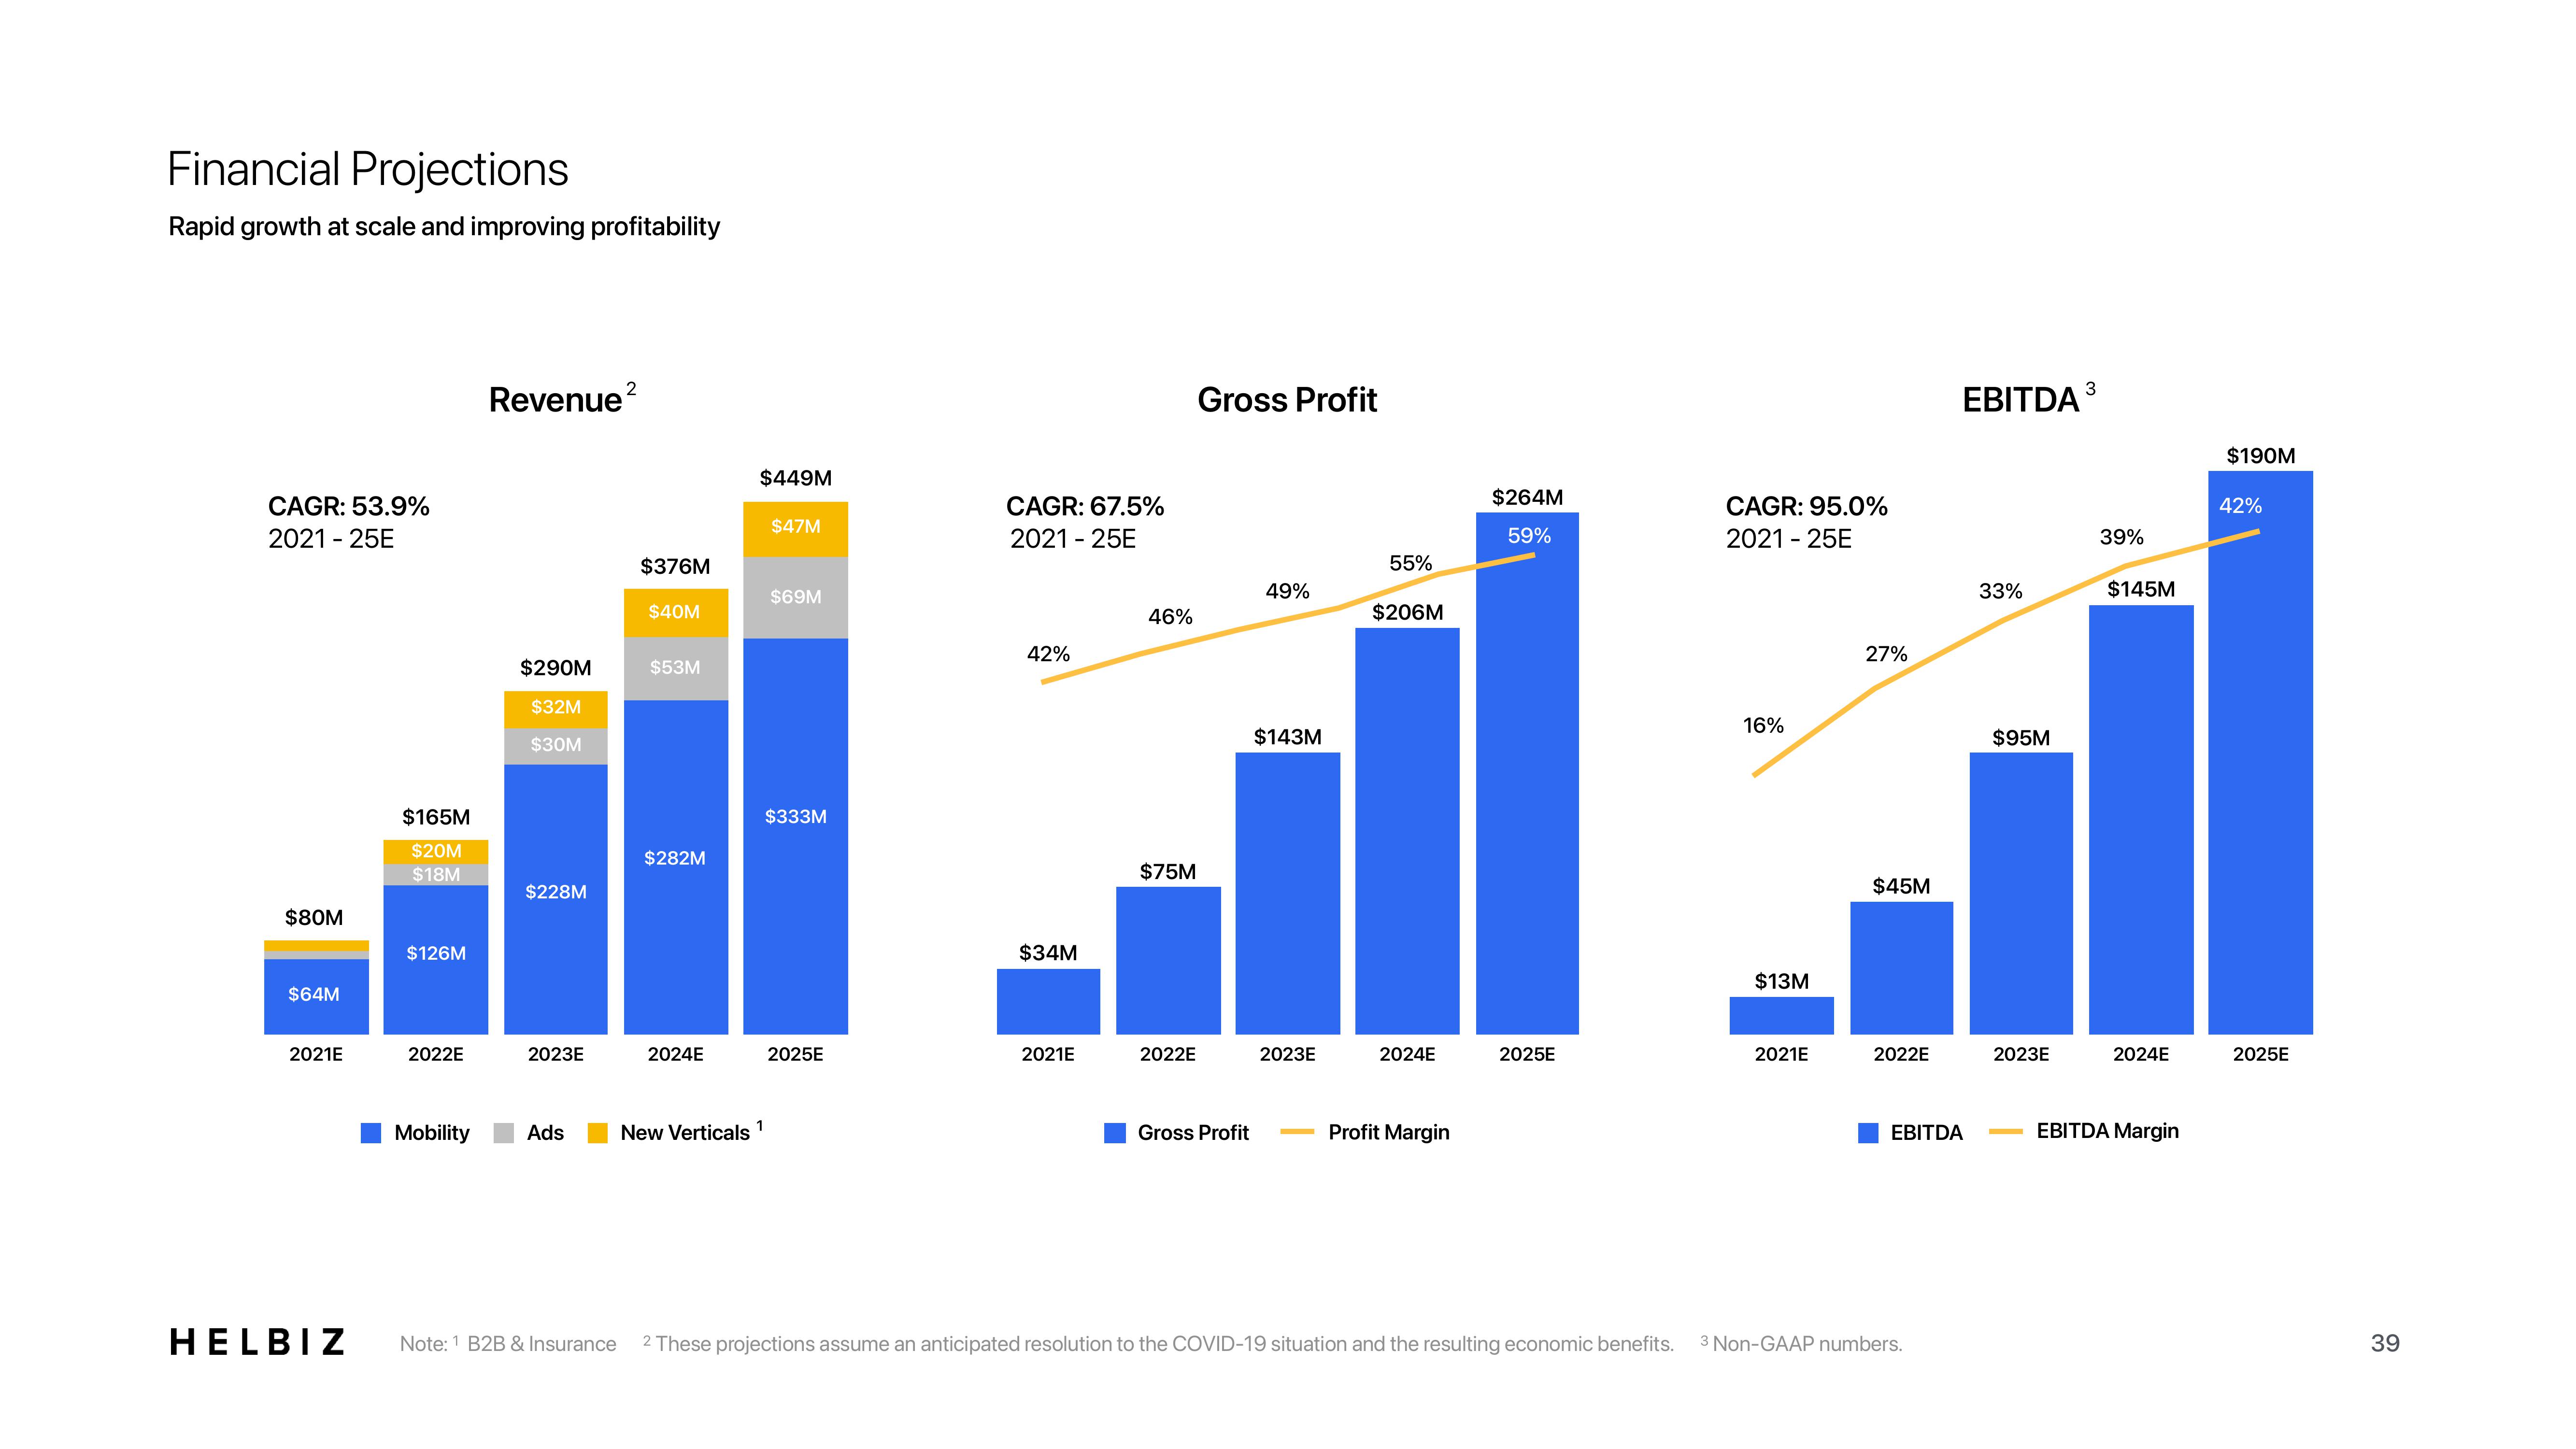
Financial Projections Rapid growth at scale and improving profitability CAGR: 53.9% 2021-25E $80M $64M 2021E HELBIZ $165M $20M $18M $126M 2022E Mobility Revenue ² $290M $32M $30M $228M 2023E Ads $376M $40M $53M $282M 2024E New Verticals $449M $47M $69M $333M 2025E CAGR:67.5% 2021-25E 42% $34M 2021E 46% $75M 2022E Gross Profit Gross Profit 49% $143M 2023E 55% $206M 2024E -Profit Margin $264M 59% 2025E CAGR: 95.0% 2021-25E 16% $13M 2021E 27% $45M 2022E 3 EBITDA ³ EBITDA Note: 1 B2B & Insurance 2 These projections assume an anticipated resolution to the COVID-19 situation and the resulting economic benefits. 3 Non-GAAP numbers. 33% $95M 2023E 39% $145M 2024E EBITDA Margin $190M 42% 2025E 39
View entire presentation