Tudor, Pickering, Holt & Co Investment Banking
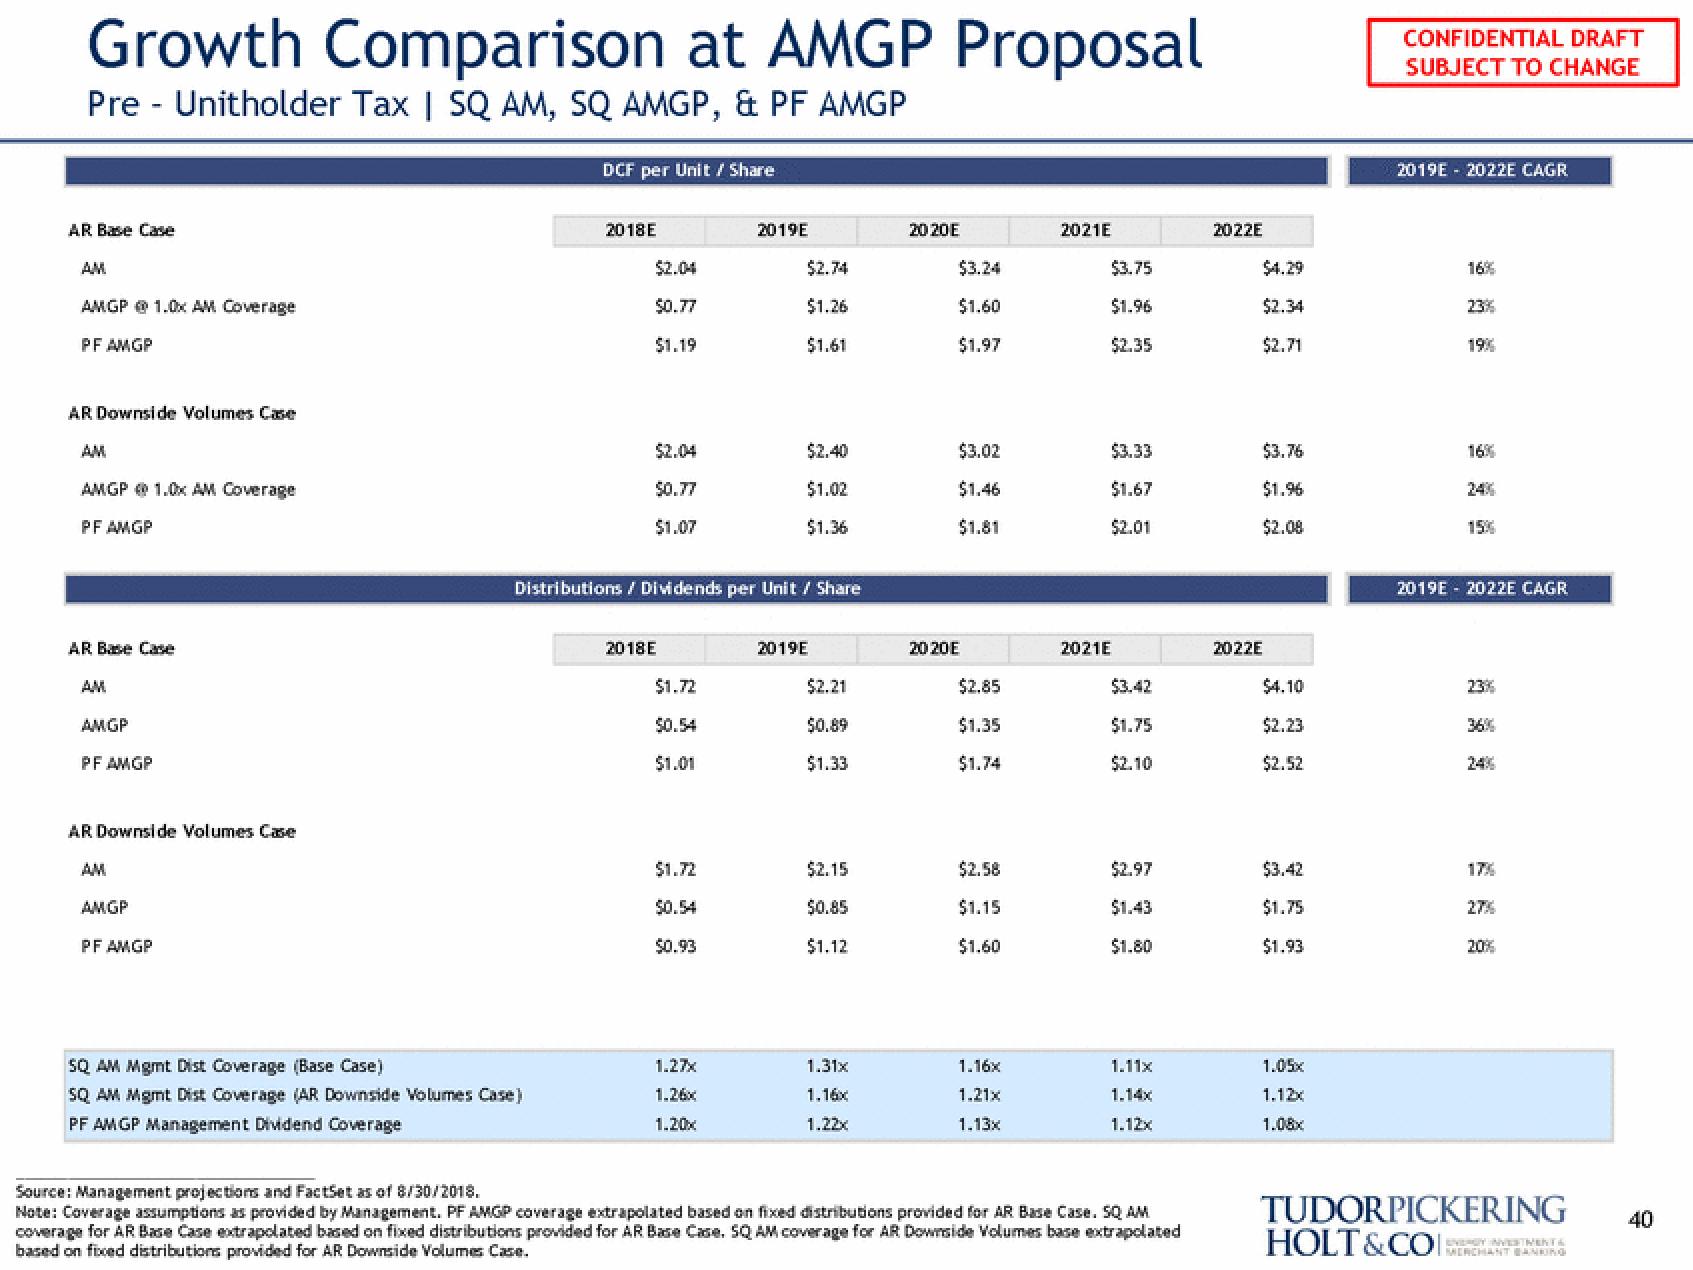
Growth Comparison at AMGP Proposal
Pre - Unitholder Tax | SQ AM, SQ AMGP, & PF AMGP
AR Base Case
AM
AMGP @ 1.0x AM Coverage
PF AMGP
AR Downside Volumes Case
AM
AMGP 1.0x AM Coverage
PF AMGP
AR Base Case
AMGP
PF AMGP
AR Downside Volumes Case
AMGP
PF AMGP
DCF per Unit / Share
SQ AM Mgmt Dist Coverage (Base Case)
SQ AM Mgmt Dist Coverage (AR Downside Volumes Case)
PF AMGP Management Dividend Coverage
2018E
$0.77
$1.19
$0.77
$1.07
2018E
Distributions / Dividends per Unit / Share
$1.72
$0.54
$1.01
$1.72
$0.93
2019E
1.27x
1.26x
1.20x
$2.74
$1.26
$1.61
$2.40
$1.02
$1.36
2019E
$2.21
$0.89
$1.33
$2.15
$0.85
$1.12
1.31x
1.16x
1.22x
20 20 E
$3.24
$1.60
$1.97
$3.02
$1.46
$1.81
20 20 E
$2.85
$1.35
$1.74
$2.58
$1.15
$1.60
1.16x
1.21x
1.13x
2021E
$3.75
$1.96
$2.35
$3.33
$1.67
$2.01
2021E
$3.42
$1.75
$2.10
$2.97
$1.43
$1.80
1.11x
1.14x
1.12x
Source: Management projections and FactSet as of 8/30/2018.
Note: Coverage assumptions as provided by Management. PF AMGP coverage extrapolated based on fixed distributions provided for AR Base Case. SQ AM
coverage for AR Base Case extrapolated based on fixed distributions provided for AR Base Case. SQ AM coverage for AR Downside Volumes base extrapolated
based on fixed distributions provided for AR Downside Volumes Case.
2022E
$4.29
$2.34
$2.71
$3.76
$1.96
$2.08
2022E
$4.10
$2.23
$2.52
$3.42
$1.75
$1.93
1.05x
1.12x
1.08x
CONFIDENTIAL DRAFT
SUBJECT TO CHANGE
2019E - 2022E CAGR
16%
23%
19%
16%
15%
2019E - 2022E CAGR
23%
24%
17%
27%
20%
TUDORPICKERING
HOLT&CO
MERCHANT BANKING
40View entire presentation