Overstock Results Presentation Deck
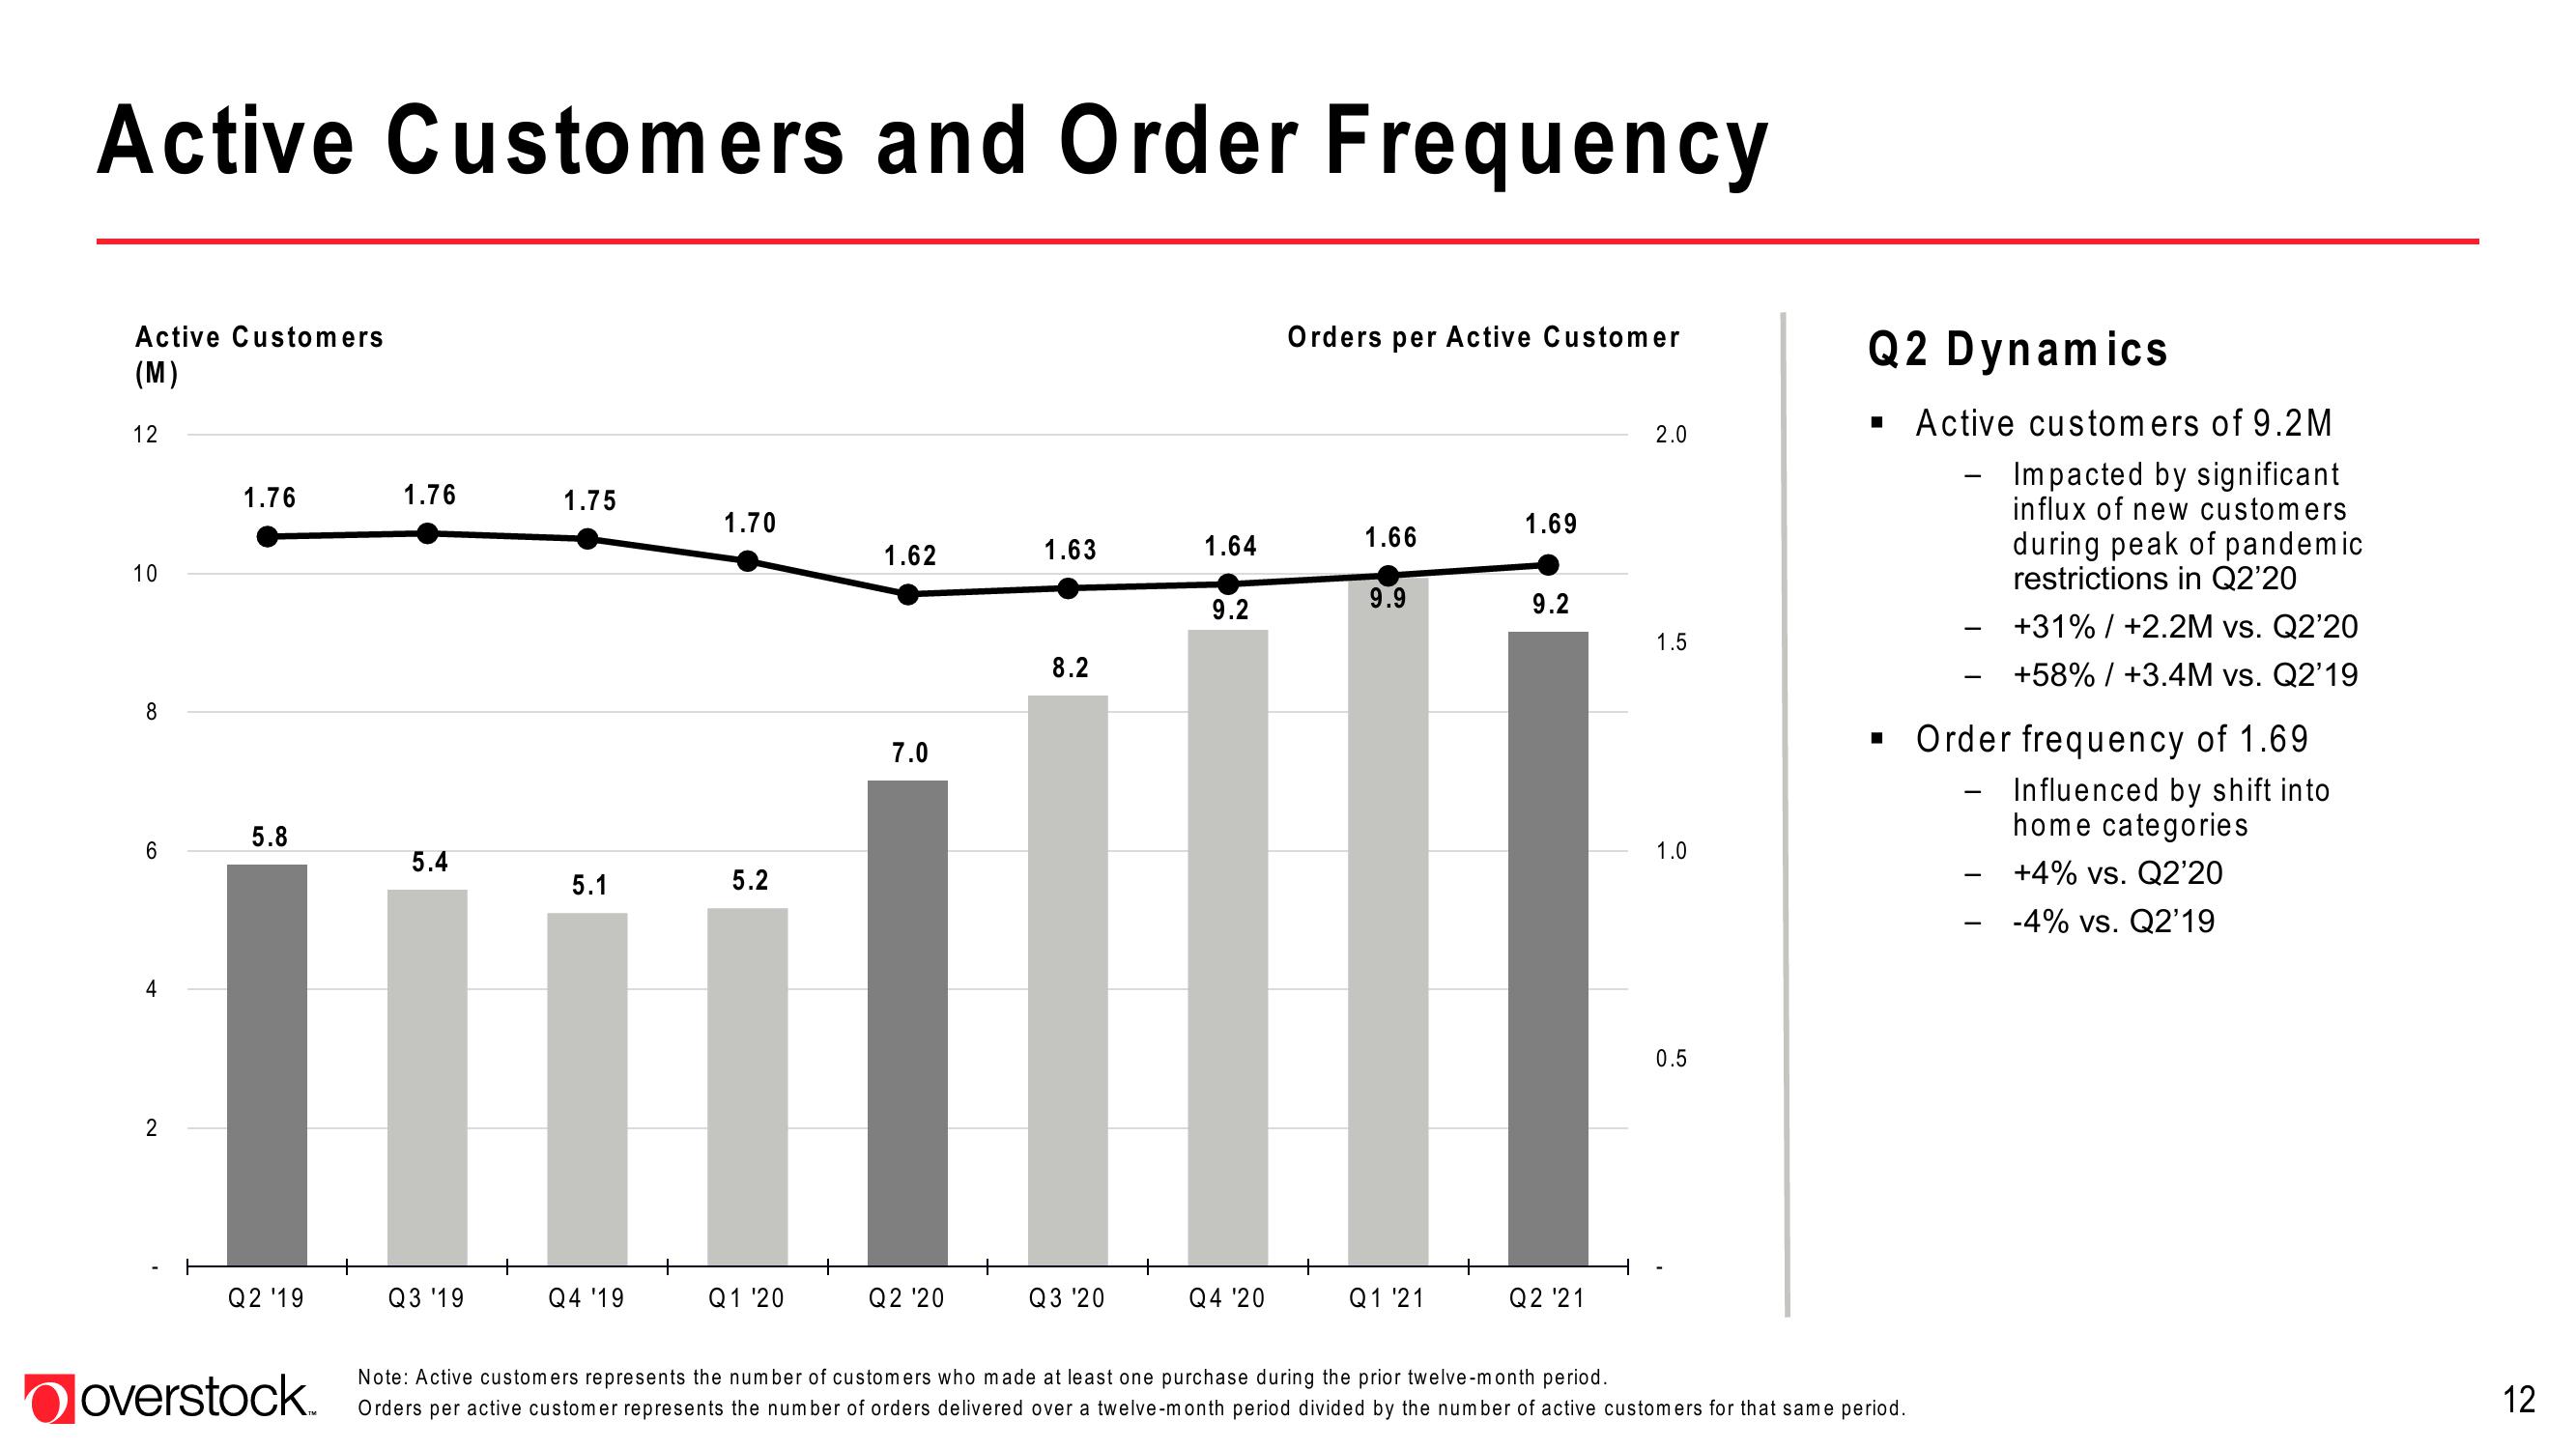
Active Customers and Order Frequency
Active Customers
(M)
12
10
8
6
4
2
1.76
5.8
Q2 '19
overstock.
1.76
5.4
Q3 '19
1.75
5.1
Q4 '19
1.70
5.2
Q1 '20
1.62
7.0
Q2 '20
1.63
8.2
Q3 '20
1.64
9.2
Q4 '20
Orders per Active Customer
1.66
9.9
Q1 '21
1.69
9.2
Q2 '21
2.0
1.5
1.0
0.5
Q2 Dynamics
■ Active customers of 9.2M
Impacted by significant
influx of new customers
during peak of pandemic
restrictions in Q2'20
+31%/ +2.2M vs. Q2'20
+58% / +3.4M vs. Q2'19
■ Order frequency of 1.69.
Influenced by shift into
home categories
+4% vs. Q2'20
-4% vs. Q2'19
Note: Active customers represents the number of customers who made at least one purchase during the prior twelve-month period.
Orders per active customer represents the number of orders delivered over a twelve-month period divided by the number of active customers for that same period.
12View entire presentation