Cheesecake Factory Investor Presentation Deck slide image

Cheesecake Factory Investor Presentation Deck

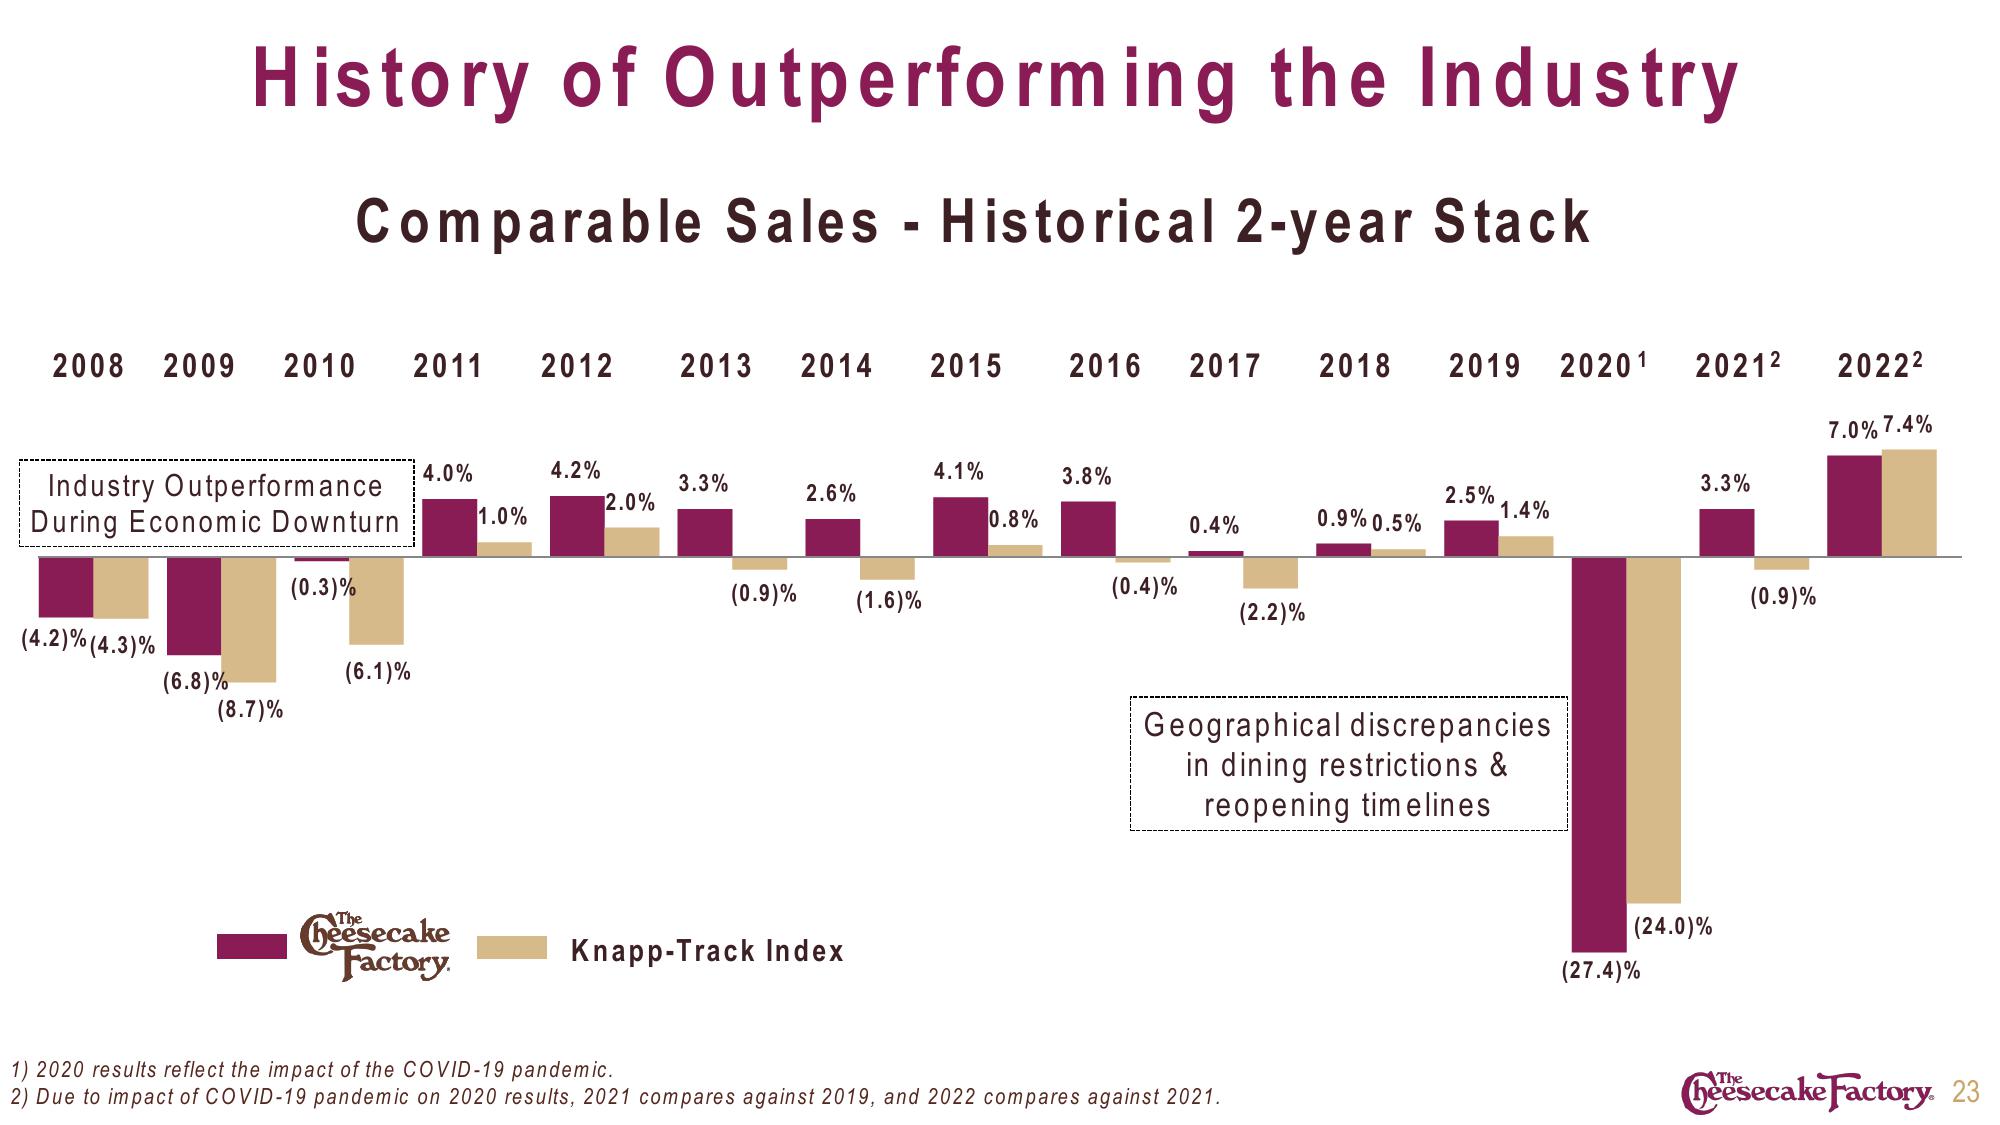
2008 2009 2010 2011 2012 2013 2014 2015 2016 2017 History of Outperforming the Industry Comparable Sales - Historical 2-year Stack Industry Outperformance During Economic Downturn (0.3)% (4.2)% (4.3)% (6.8)% (8.7)% (6.1)% 4.0% heesecake Factory. 1.0% 4.2% 2.0% 3.3% (0.9)% 2.6% Knapp-Track Index (1.6)% 4.1% 0.8% 3.8% (0.4)% 0.4% (2.2)% 1) 2020 results reflect the impact of the COVID-19 pandemic. 2) Due to impact of COVID-19 pandemic on 2020 results, 2021 compares against 2019, and 2022 compares against 2021. 2018 2019 20201 0.9% 0.5% 2.5% 1.4% Geographical discrepancies in dining restrictions & reopening timelines 2021² (27.4)% 3.3% (24.0)% (0.9)% 2022² 7.0% 7.4% Cheesecake Factory 23
View entire presentation