Netstreit Investor Presentation Deck
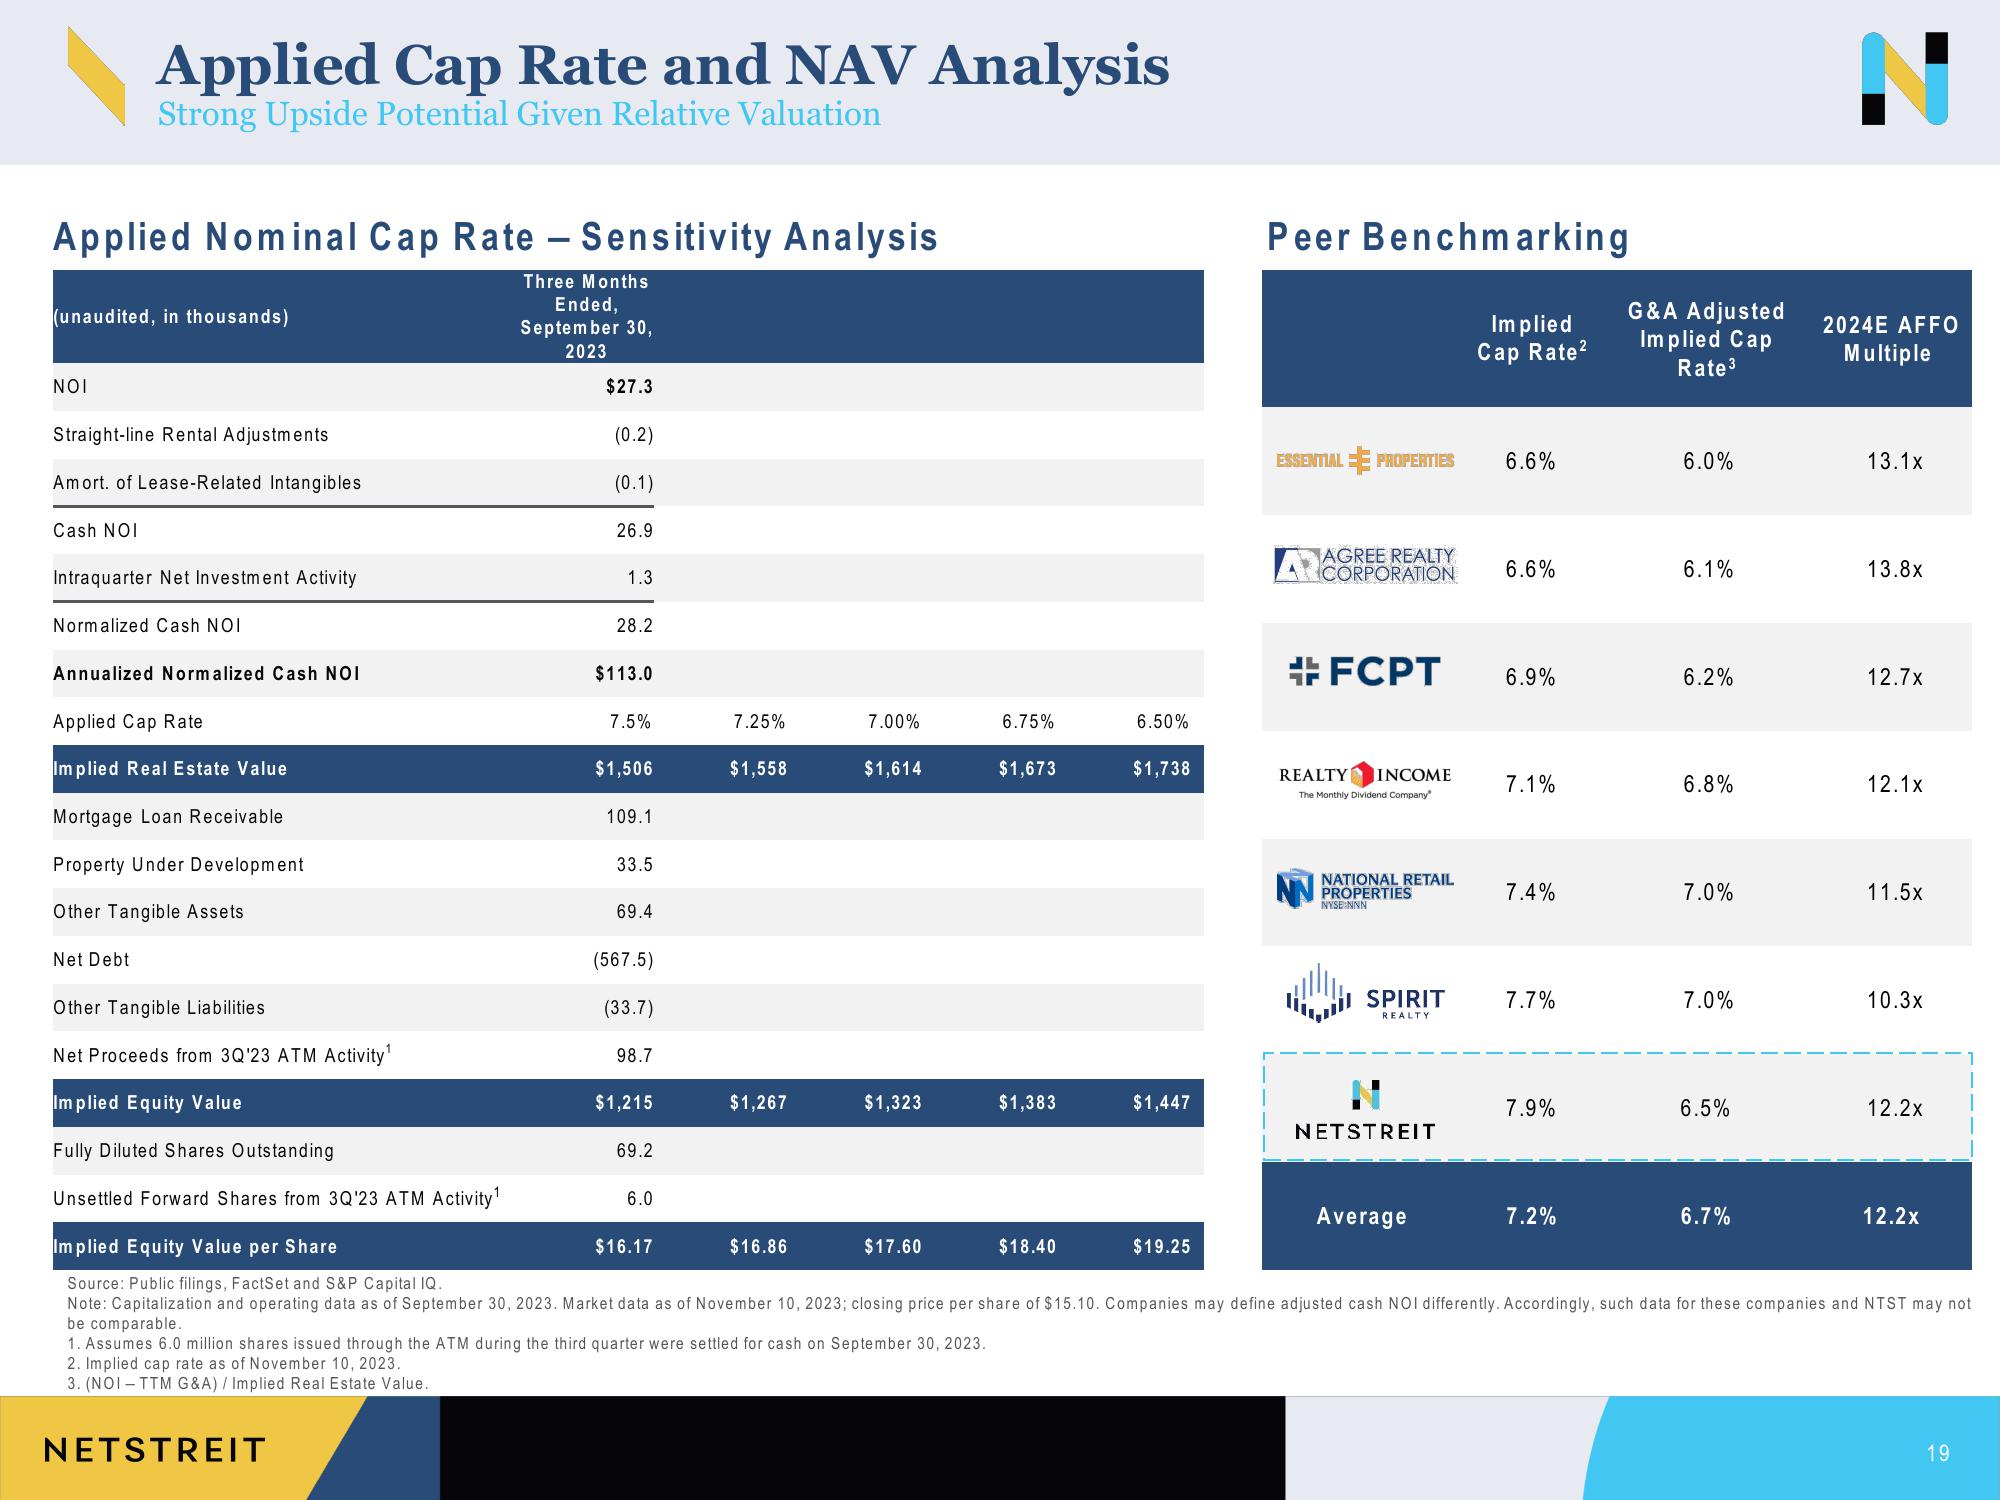
Applied Nominal Cap Rate - Sensitivity Analysis
Three Months
(unaudited, in thousands)
NOI
Applied Cap Rate and NAV Analysis
Strong Upside Potential Given Relative Valuation
Straight-line Rental Adjustments
Amort. of Lease-Related Intangibles
Cash NOI
Intraquarter Net Investment Activity
Normalized Cash NOI
Annualized Normalized Cash NOI
Applied Cap Rate
Implied Real Estate Value
Mortgage Loan Receivable
Property Under Development
Other Tangible Assets
Net Debt
Ended,
September 30,
2023
NETSTREIT
$27.3
(0.2)
(0.1)
26.9
1.3
28.2
$113.0
7.5%
$1,506
109.1
33.5
69.4
(567.5)
(33.7)
98.7
$1,215
69.2
6.0
7.25%
$16.17
$1,558
$1,267
7.00%
$16.86
$1,614
$1,323
6.75%
$17.60
$1,673
$1,383
6.50%
$18.40
$1,738
$1,447
Peer Benchmarking
Implied
Cap Rate²
$19.25
ESSENTIAL PROPERTIES
AGREE REALTY
CORPORATION
#FCPT
REALTY INCOME
The Monthly Dividend Company
NATIONAL RETAIL
PROPERTIES
NYSE:NNN
SPIRIT
REALTY
NETSTREIT
6.6%
Average
6.6%
6.9%
7.1%
7.4%
Other Tangible Liabilities
Net Proceeds from 3Q'23 ATM Activity¹
Implied Equity Value
Fully Diluted Shares Outstanding
Unsettled Forward Shares from 3Q'23 ATM Activity¹
Implied Equity Value per Share
Source: Public filings, FactSet and S&P Capital IQ.
Note: Capitalization and operating data as of September 30, 2023. Market data as of November 10, 2023; closing price per share of $15.10. Companies may define adjusted cash NOI differently. Accordingly, such data for these companies and NTST may not
be comparable.
1. Assumes 6.0 million shares issued through the ATM during the third quarter were settled for cash on September 30, 2023.
2. Implied cap rate as of November 10, 2023.
3. (NOI-TTM G&A) / Implied Real Estate Value.
7.7%
7.9%
G&A Adjusted
Implied Cap
Rate ³
7.2%
6.0%
6.1%
6.2%
6.8%
7.0%
7.0%
6.5%
2024E AFFO
Multiple
6.7%
13.1x
13.8x
12.7x
12.1x
11.5x
10.3x
12.2x
12.2x
19View entire presentation