J.P.Morgan Investment Banking
APPENDIX
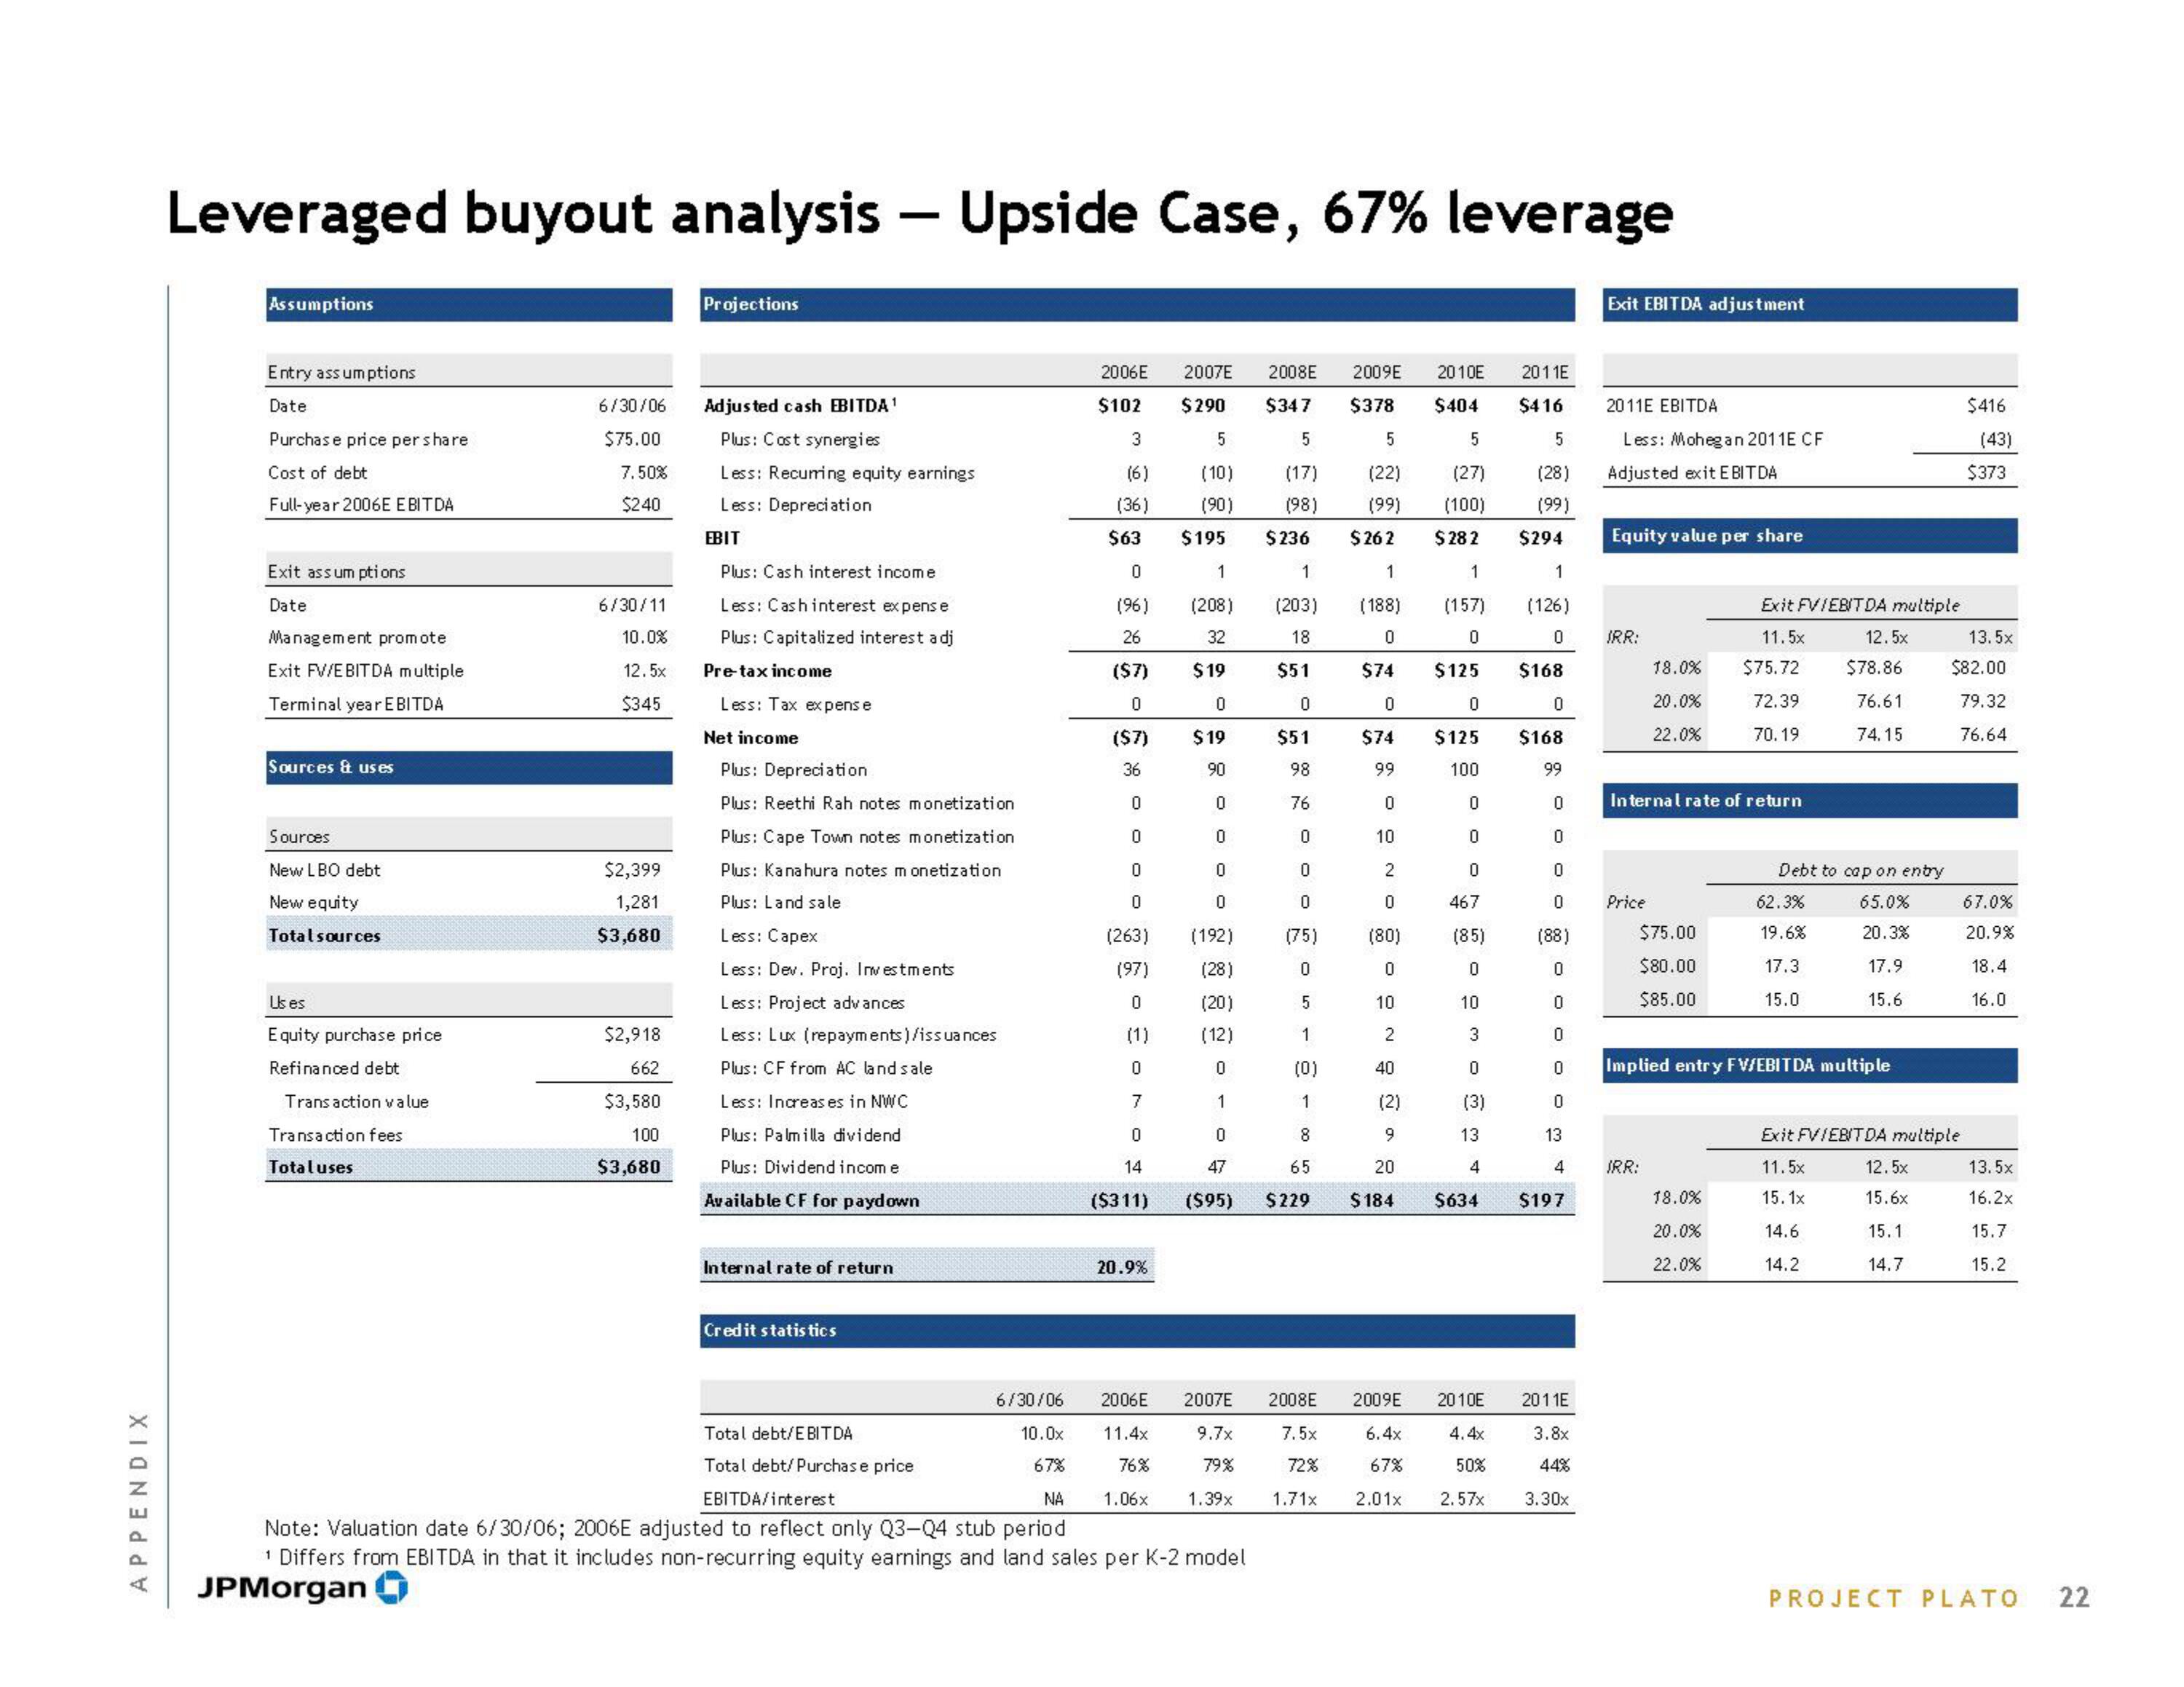
Leveraged buyout analysis - Upside Case, 67% leverage
Assumptions
Entry assumptions
Date
Purchase price per share
Cost of debt
Full-year 2006E EBITDA
Exit ass um ptions
Date
Management promote
Exit FV/EBITDA multiple
Terminal year EBITDA
Sources & us es
Sources
New LBO debt
New equity
Total sources
Us es
Equity purchase price
Refinanced debt
Transaction value
Transaction fees
Totaluses
6/30/06
$75.00
7.50%
$240
6/30/11
10.0%
12.5x
$345
$2,399
1,281
$3,680
$2,918
662
$3,580
100
$3,680
Projections
Adjusted cash EBITDA¹
Plus: Cost synergies
Less: Recurring equity earnings
Less: Depreciatio
EBIT
Plus: Cash interest income
Less: Cash interest expense
Plus: Capitalized interest adj
Pre-tax income
Less: Tax expens e
Net income
Plus: Depreciation
Plus: Reethi Rah notes monetization
Plus: Cape Town notes monetization
Plus: Kanahura notes monetization
Plus: Land sale
Less: Capex
Less: Dev. Proj. Investments
Less: Project advances
Less: Lux (repayments)/issuances
Plus: CF from AC land sale
Less: Increases in NWC
Plus: Palmilla dividend
Plus: Dividend income
Available CF for paydown
Internal rate of return
Credit statistics
2006E
$102
Total debt/EBITDA
Total debt/Purchase price
3
(6)
(36
$63
0
1
(96) (208)
32
$19
26
($7)
0
($7)
0
$19
36
90
0
0
0
0
0
0
0
0
(263)
(97)
0
(1)
0
7
0
14
($311)
20.9%
$290
5
(10)
(90)
$195
2007E 2008E 2009E 2010E 2011E
$378 $404 $416
5
5
5
(22) (27) (28)
(99)
(100) (99)
$262 $282 $294
1
1
1
(188) (157) (126)
0
0
$125 $168
$347
5
(17)
(98)
$236
1
(203)
18
$51
0
$51
98
0
$74
0
$74
0
0
$125 $168
100
99
99
76
0
0
0
0
467
2006E
11.4x
76%
1.06x
(192)
(28)
(20)
(12)
0
1
6/30/06
10.0x
67%
EBITDA/interest
NA
Note: Valuation date 6/30/06; 2006E adjusted to reflect only Q3-Q4 stub period
¹ Differs from EBITDA in that it includes non-recurring equity earnings and land sales per K-2 model
JPMorgan
0
ge-006
(75)
(0)
10
2
0
(80)
0
10
2
40
(2)
9
(85)
0
10
3
0
(3)
13
4
0
47
20
($95) $229 $184 $634
4.4x
2007E 2008E 2009E 2010E
9.7x 7.5x 6.4x
79%
1.39x 1.71x
72%
50%
67%
2.01x
2.57x
0
0
0
0
(88)
0
0
0
0
0
13
4
$197
2011E
3.8x
44%
3.30x
Exit EBITDA adjustment
2011E EBITDA
Less: Mohegan 2011E CF
Adjusted exit EBITDA
Equity value per share
IRR:
Price
18.0%
20.0%
22.0%
Internal rate of return
$75.00
$80.00
$85.00
IRR:
Exit FVIEBITDA multiple
11.5x
$75.72
72.39
70.19
18.0%
20.0%
22.0%
12.5x
62.3%
19.6%
17.3
15.0
$78.86
76.61
74.15
Debt to cap on entry
65.0%
20.3%
17.9
15.6
Implied entry FVEBITDA multiple
Exit FV/EBITDA multiple
11.5x
15.1x
14.6
14.2
12.5x
15.6x
15.1
14.7
$416
(43)
$373
13.5x
$82.00
79.32
76.64
67.0%
20.9%
18.4
16.0
13.5x
16.2x
15.7
15.2
PROJECT PLATO
22View entire presentation