Experian Investor Presentation Deck
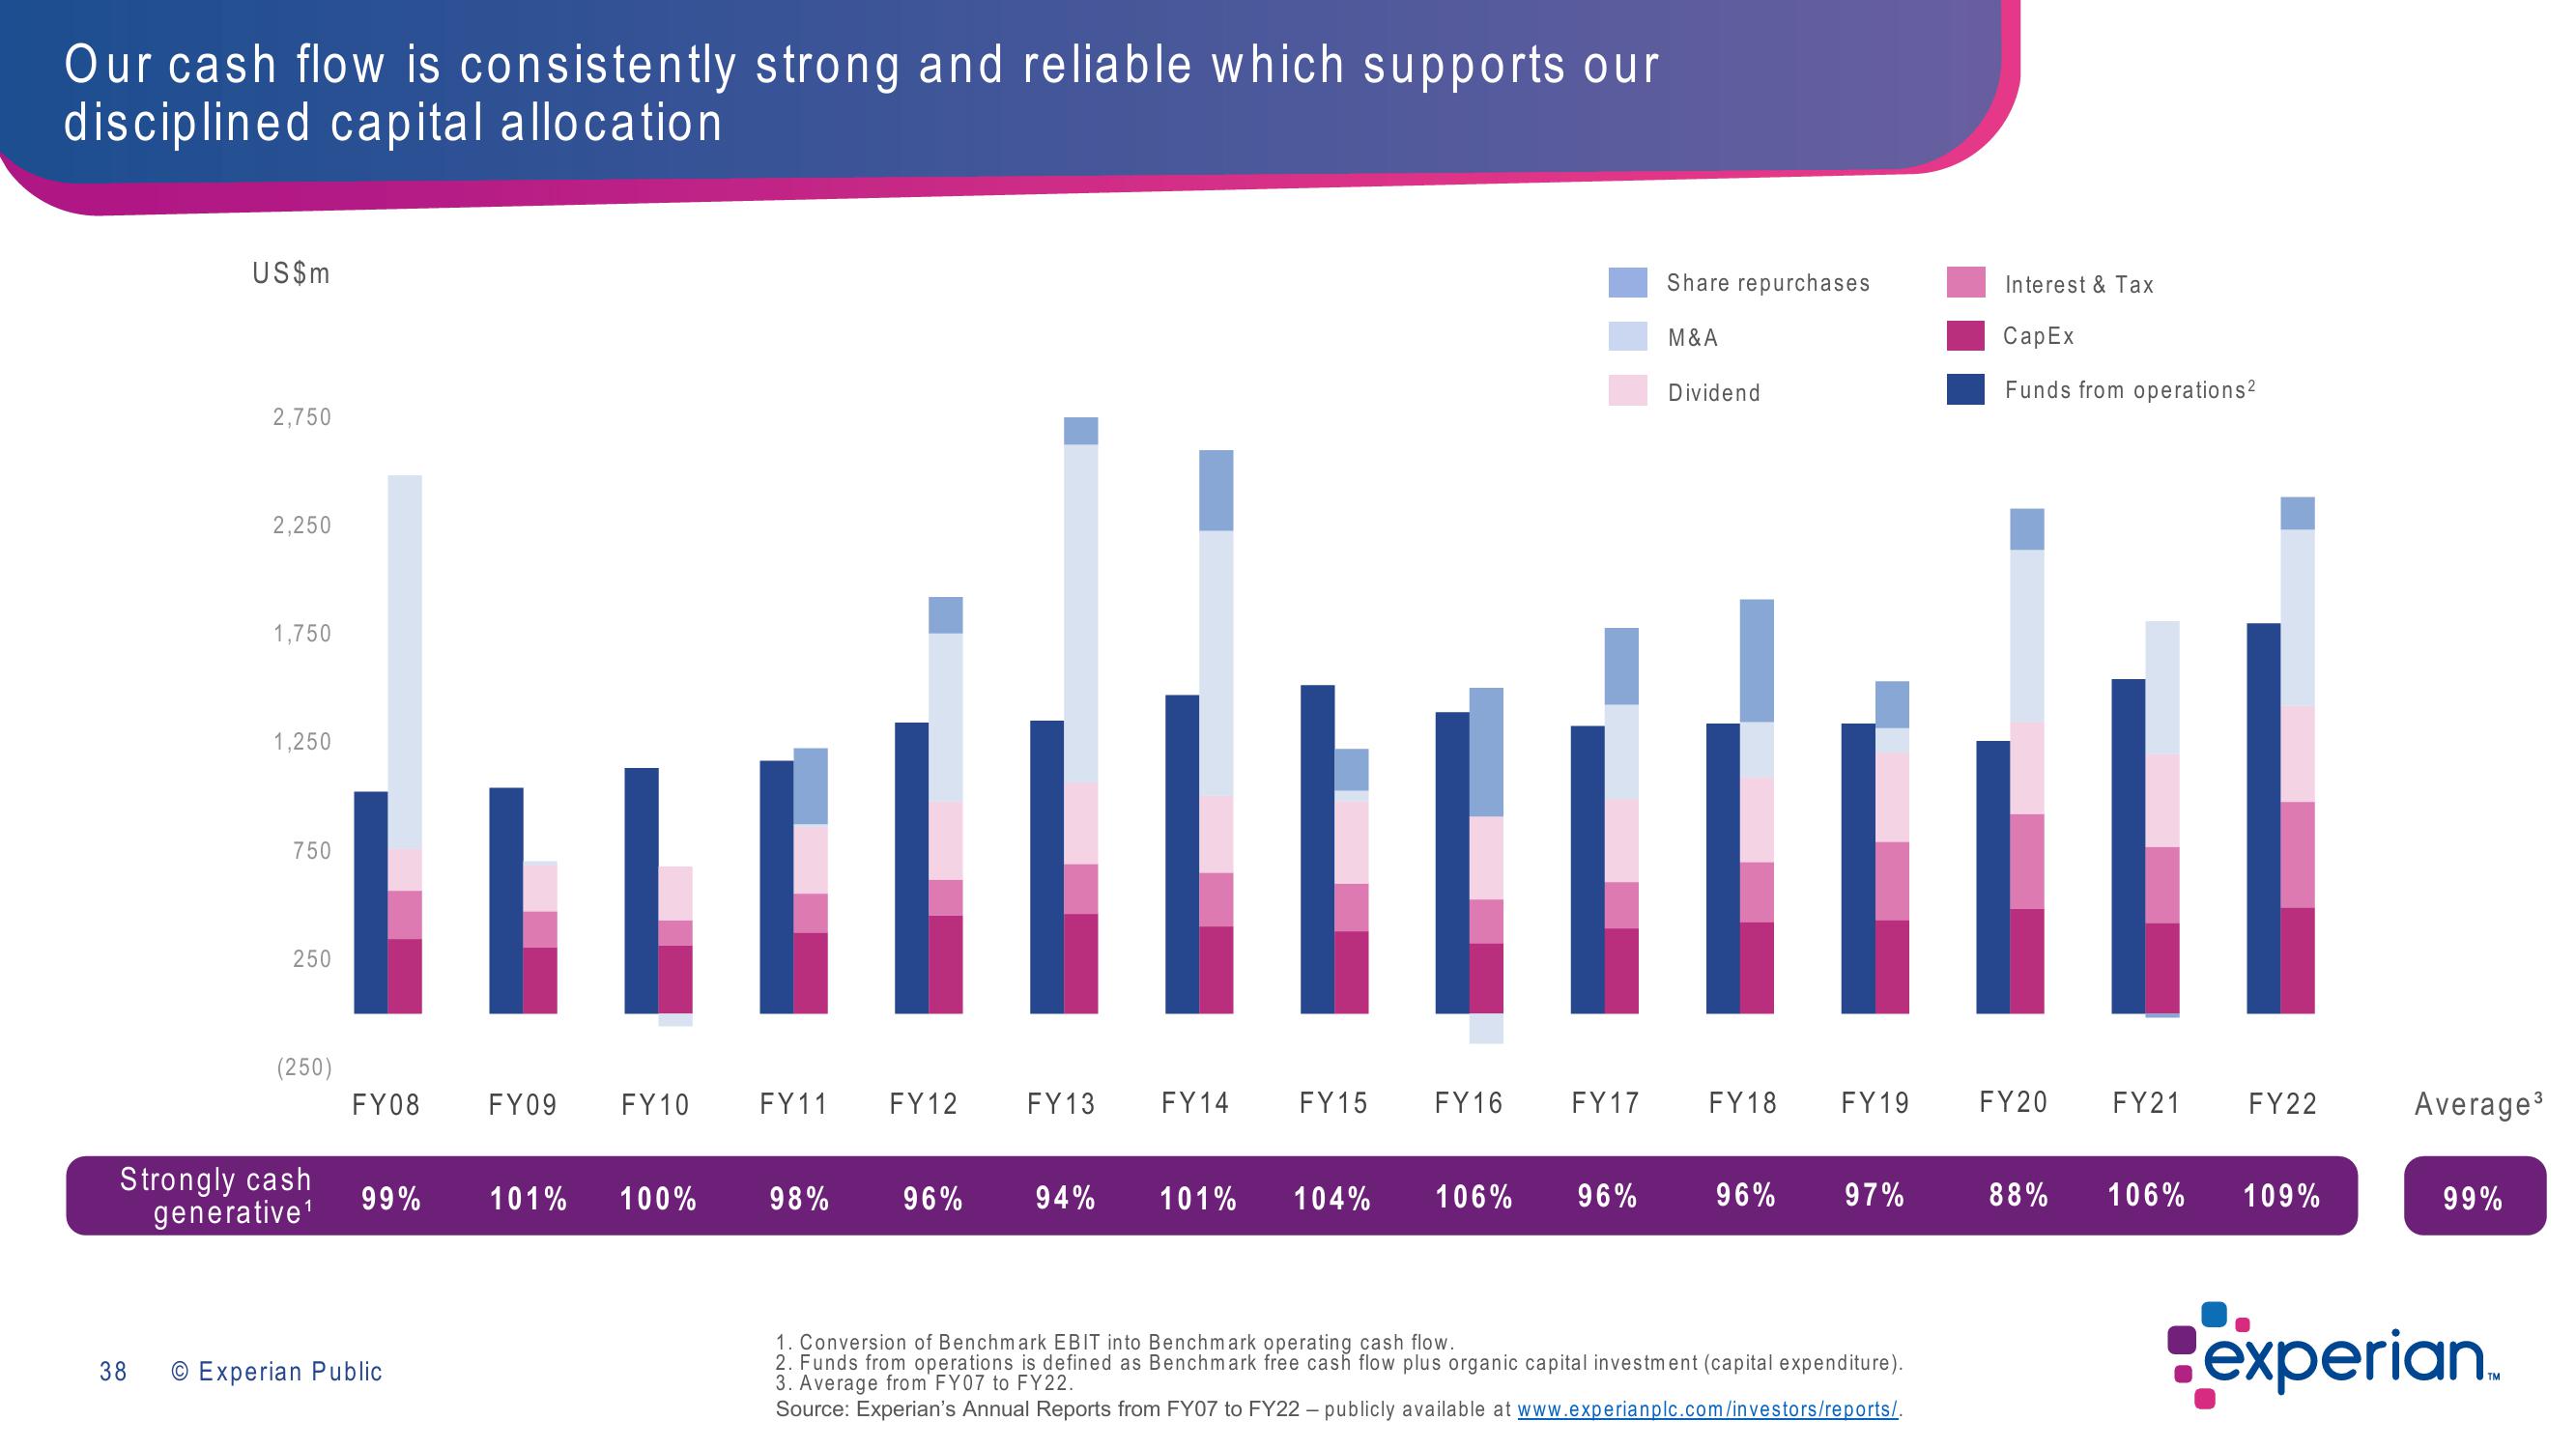
Our cash flow is consistently strong and reliable which supports our
disciplined capital allocation
US$m
38
2,750
2,250
1,750
1,250
750
250
(250)
Strongly cash
generative¹
FY08
99%
O Experian Public
FY09
FY10
101% 100%
FY11
98%
FY12
96%
FY13
94%
FY14
101%
FY15
I
FY16
FY17
104% 106% 96%
Share repurchases
M&A
Dividend
FY18 FY19
96% 97%
1. Conversion of Benchmark EBIT into Benchmark operating cash flow.
2. Funds from operations is defined as Benchmark free cash flow plus organic capital investment (capital expenditure).
3. Average from FY07 to FY22.
Source: Experian's Annual Reports from FY07 to FY22 - publicly available at www.experianplc.com/investors/reports/.
Interest & Tax
Cap Ex
Funds from operations²
FY20
88%
FY21
FY22
106% 109%
Average³
99%
experianView entire presentation