Hydrafacial Investor Conference Presentation Deck
APPENDIX
Description of Non-GAAP Financial Measures
In addition to results determined in accordance with accounting principles generally accepted in the United States of America (GAAP), management utilizes certain non-GAAP financial measures such
as Adjusted Gross Margin for purposes of evaluating ongoing operations and for internal planning and forecasting purposes. We believe this non-GAAP financial measure, when reviewed collectively
with our GAAP financial information, provides useful supplemental information to investors in assessing our operating performance. This non-GAAP financial measure should not be considered as an
alternative to GAAP financial information or as an indication of operating performance or any other measure of performance derived in accordance with GAAP, and may not provide information that is
directly comparable to that provided by other companies in its industry, as these other companies may calculate non-GAAP financial measures differently, particularly related to non-recurring, unusual
items.
Adjusted Gross Margin
We use Adjusted Gross Margin to measure our profitability and ability to scale and leverage the costs of our Delivery Systems and Consumables net sales. The continued growth of our Delivery
Systems is expected to allow us to improve our Adjusted Gross Margin, as additional Delivery System units sold will increase our recurring Consumables net sales, which has higher margins.
We believe Adjusted Gross Margin are useful measures to the Company and our investors to assist in evaluating our operating performance because they provide consistency and direct comparability
with our past financial performance and between fiscal periods, as the metrics eliminate the effects of amortization and depreciation, which are non-cash expenses that may fluctuate for reasons
unrelated to overall continuing operating performance. Adjusted Gross Margin has been and will continue to be impacted by a variety of factors, including the product mix, geographic mix, direct vs.
indirect mix, the average selling price on Delivery Systems, and new product launches. We expect our Adjusted Gross Margin to fluctuate over time depending on the factors described above.
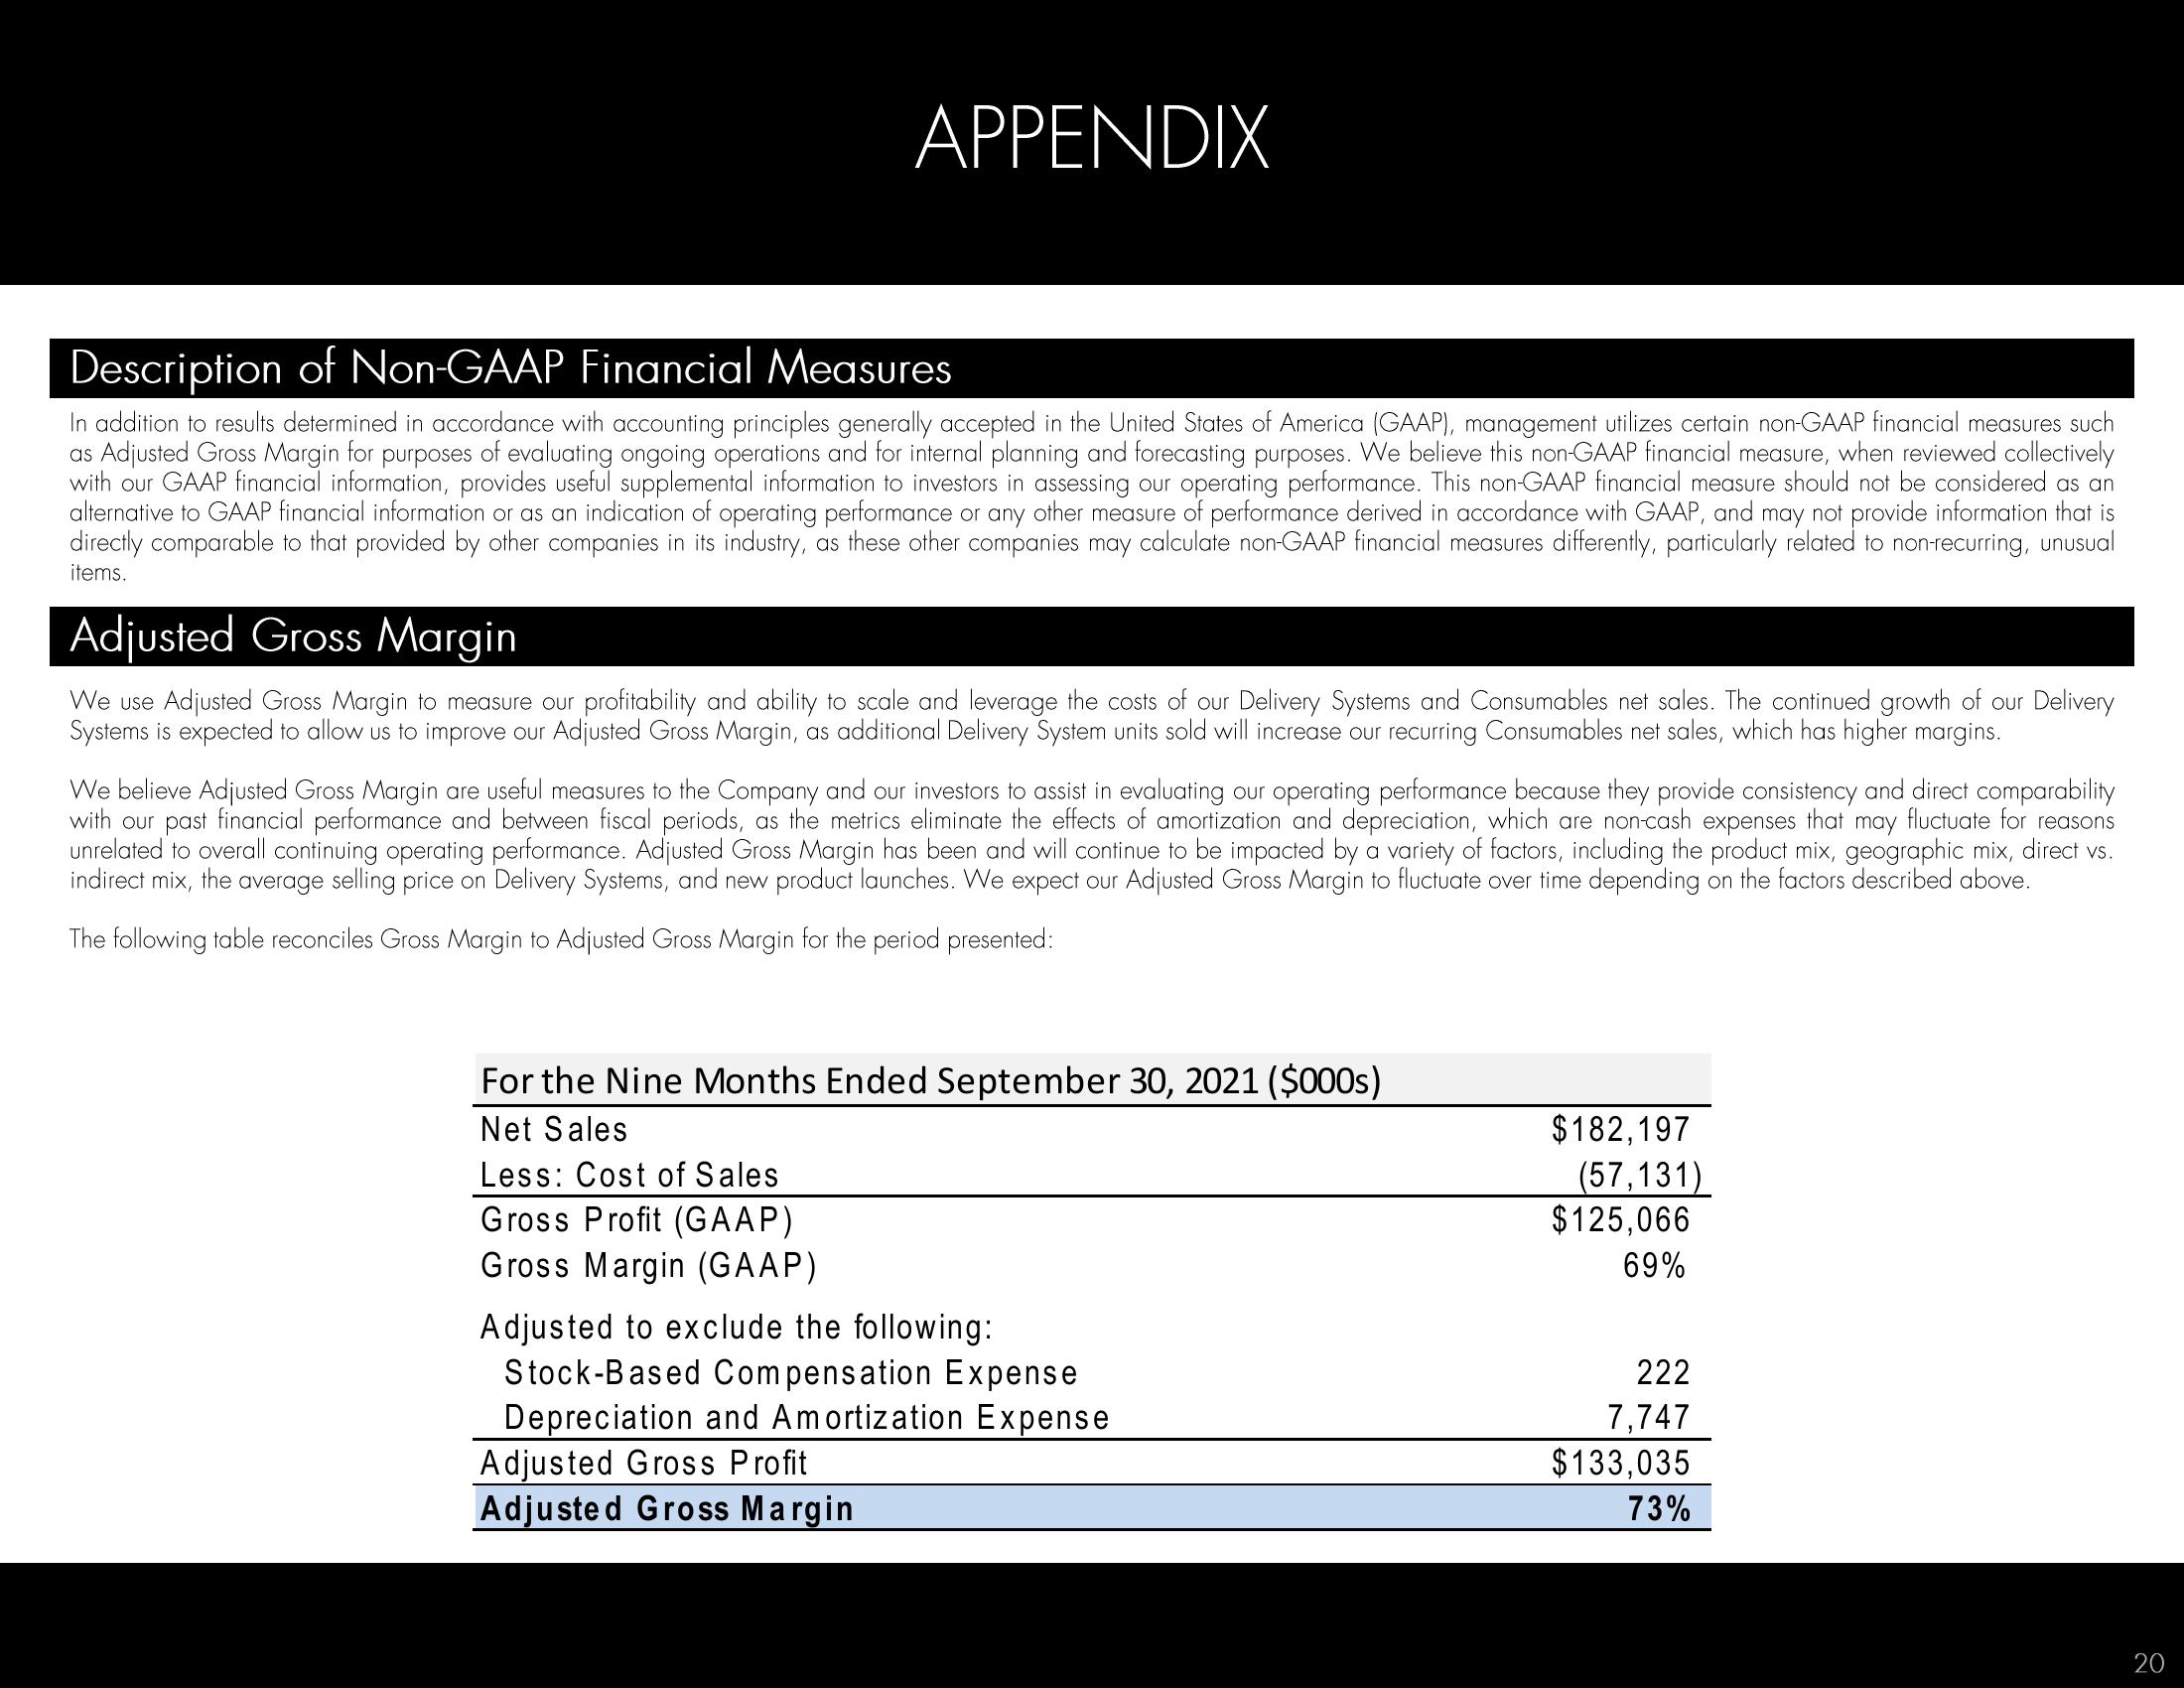
The following table reconciles Gross Margin to Adjusted Gross Margin for the period presented:
For the Nine Months Ended September 30, 2021 ($000s)
Net Sales
Less: Cost of Sales
Gross Profit (GAAP)
Gross Margin (GAAP)
Adjusted to exclude the following:
Stock-Based Compensation Expense
Depreciation and Amortization Expense
Adjusted Gross Profit
Adjusted Gross Margin
$182,197
(57,131)
$125,066
69%
222
7,747
$133,035
73%
20View entire presentation