Silicon Valley Bank Results Presentation Deck
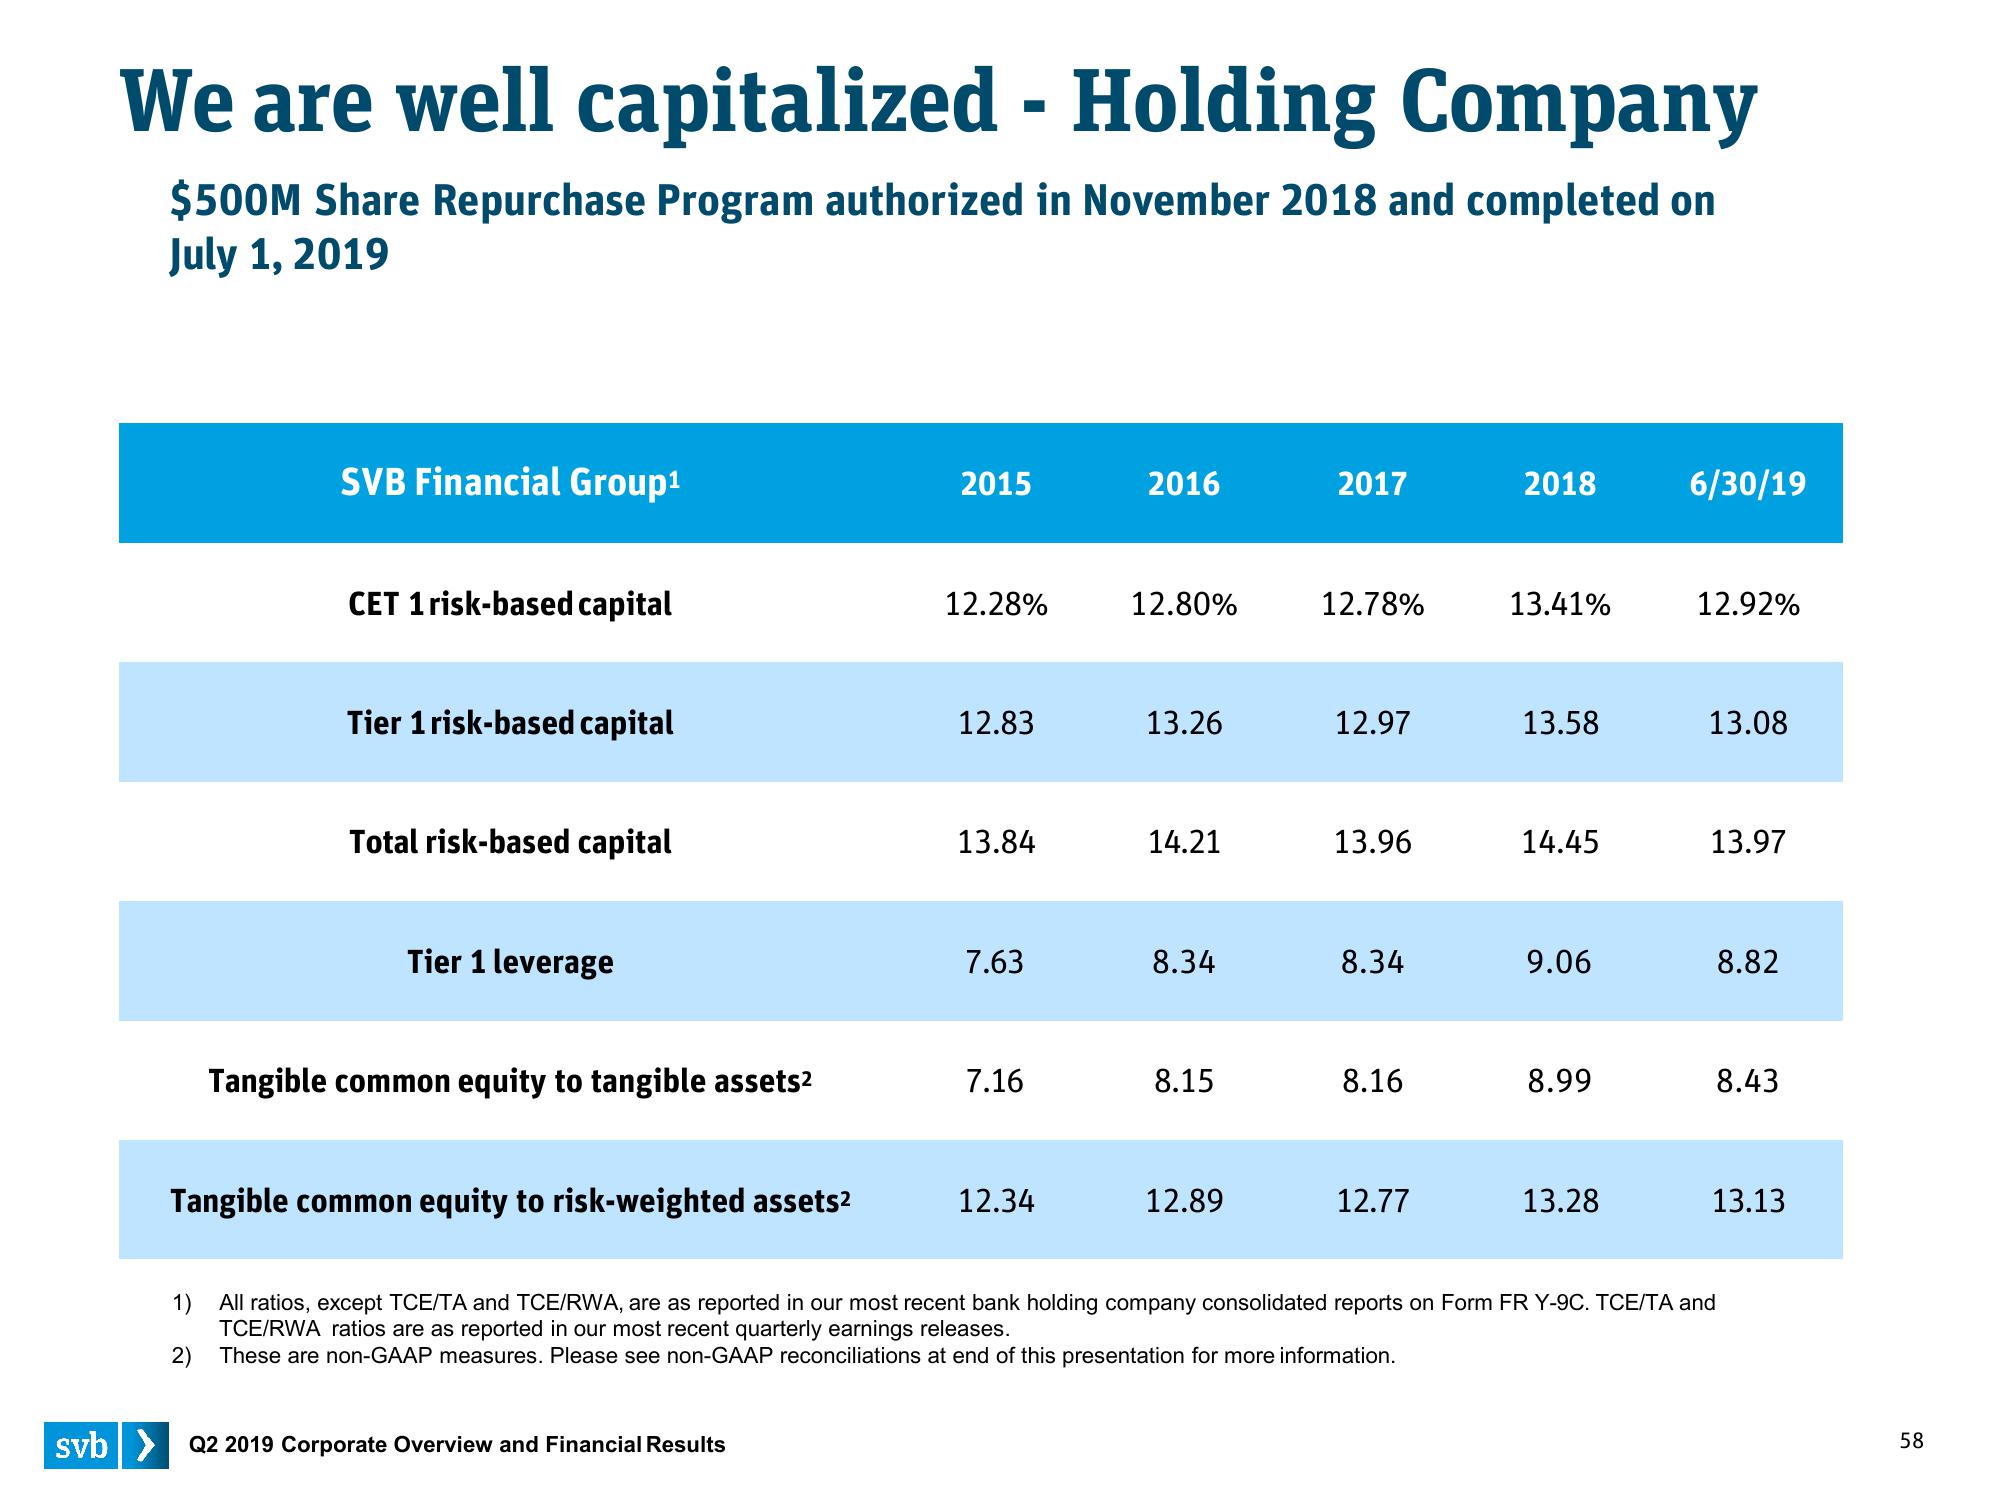
We are well capitalized - Holding Company
$500M Share Repurchase Program authorized in November 2018 and completed on
July 1, 2019
SVB Financial Group¹
CET 1 risk-based capital
Tier 1 risk-based capital
Total risk-based capital
Tier 1 leverage
Tangible common equity to tangible assets²
Tangible common equity to risk-weighted assets²
2015
svb> Q2 2019 Corporate Overview and Financial Results
12.28%
12.83
13.84
7.63
7.16
12.34
2016
12.80%
13.26
14.21
8.34
8.15
12.89
2017
12.78%
12.97
13.96
8.34
8.16
12.77
2018
13.41%
13.58
14.45
9.06
8.99
13.28
6/30/19
12.92%
13.08
13.97
1)
All ratios, except TCE/TA and TCE/RWA, are as reported in our most recent bank holding company consolidated reports on Form FR Y-9C. TCE/TA and
TCE/RWA ratios are as reported in our most recent quarterly earnings releases.
2)
These are non-GAAP measures. Please see non-GAAP reconciliations at end of this presentation for more information.
8.82
8.43
13.13
58View entire presentation