First Merchants Results Presentation Deck
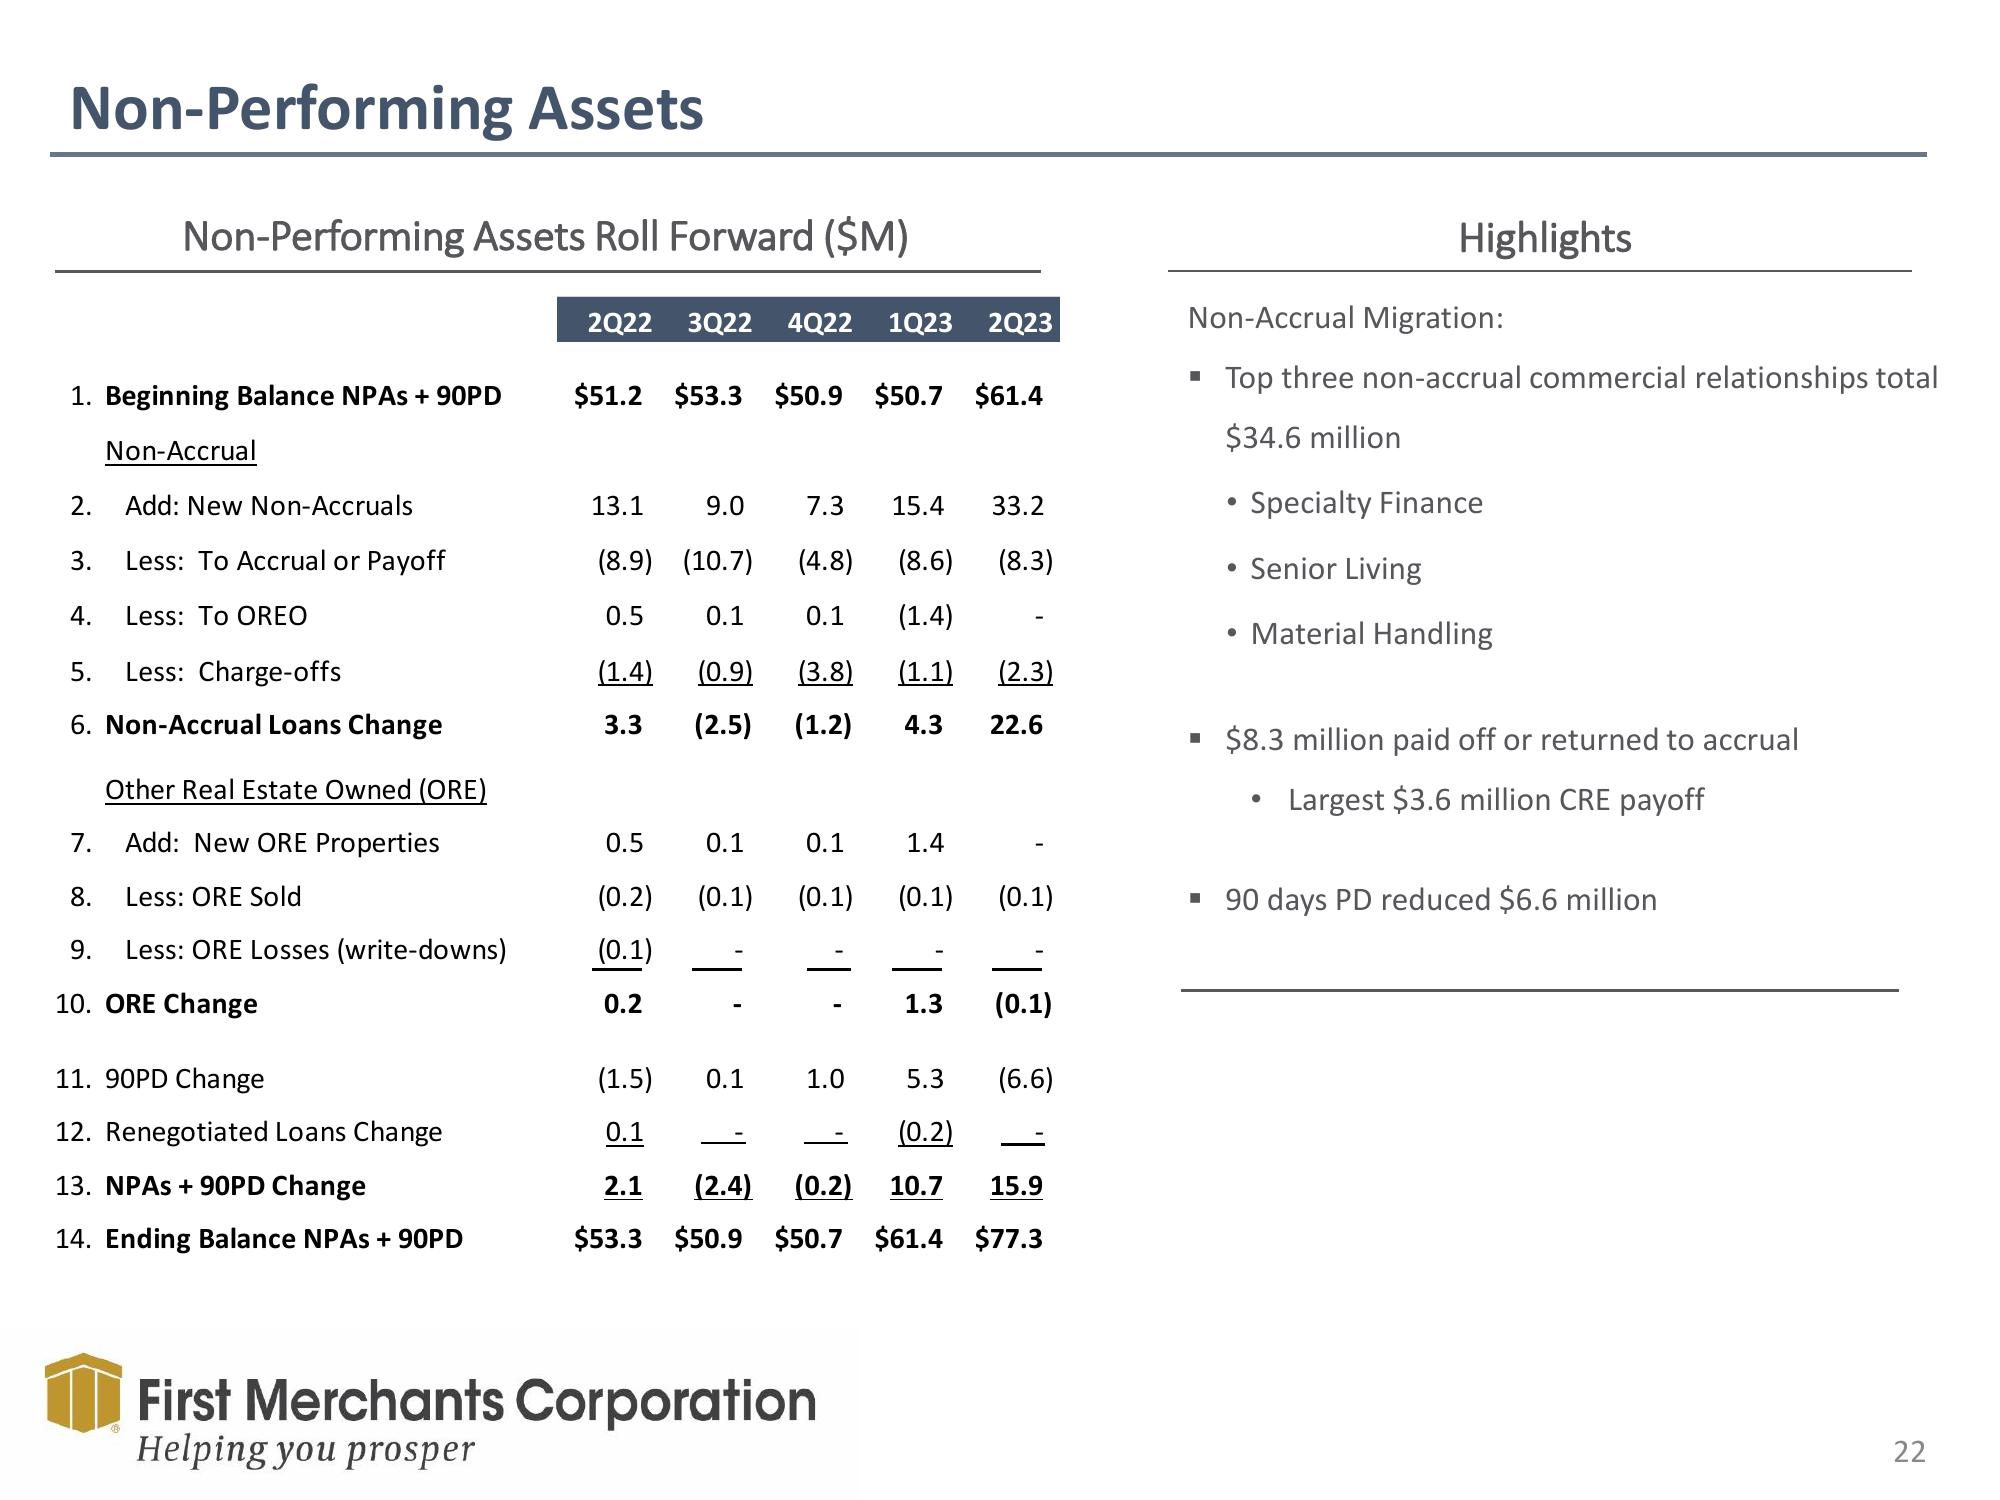
Non-Performing Assets
Non-Performing Assets Roll Forward ($M)
1. Beginning Balance NPAs + 90PD
Non-Accrual
2.
Add: New Non-Accruals
3. Less: To Accrual or Payoff
4. Less: To OREO
5. Less: Charge-offs
6. Non-Accrual Loans Change
Other Real Estate Owned (ORE)
7.
Add: New ORE Properties
8.
Less: ORE Sold
9. Less: ORE Losses (write-downs)
10. ORE Change
11. 90PD Change
12. Renegotiated Loans Change
13. NPAS + 90PD Change
14. Ending Balance NPAS + 90PD
2Q22 3Q22 4Q22 1Q23 2Q23
$51.2 $53.3 $50.9 $50.7 $61.4
13.1 9.0
(8.9) (10.7) (4.8) (8.6)
0.5
0.1 (1.4)
(1.4)
0.1
(0.9) (3.8)
(2.5) (1.2) 4.3
(1.1)
3.3
0.5
(0.2)
(0.1)
0.2
7.3 15.4 33.2
(8.3)
0.1
0.1
1.4
(0.1) (0.1) (0.1)
0.1
1.
1.0
1.3
First Merchants Corporation
Helping you prosper
(2.3)
22.6
(1.5)
5.3
0.1
(0.2)
2.1 (2.4) (0.2) 10.7
15.9
$53.3 $50.9 $50.7 $61.4 $77.3
(0.1)
(0.1)
(6.6)
--
Non-Accrual Migration:
▪ Top three non-accrual commercial relationships total
$34.6 million
●
Specialty Finance
• Senior Living
Highlights
●
Material Handling
■ $8.3 million paid off or returned to accrual
Largest $3.6 million CRE payoff
●
▪ 90 days PD reduced $6.6 million
22View entire presentation