MoneyLion SPAC Presentation Deck
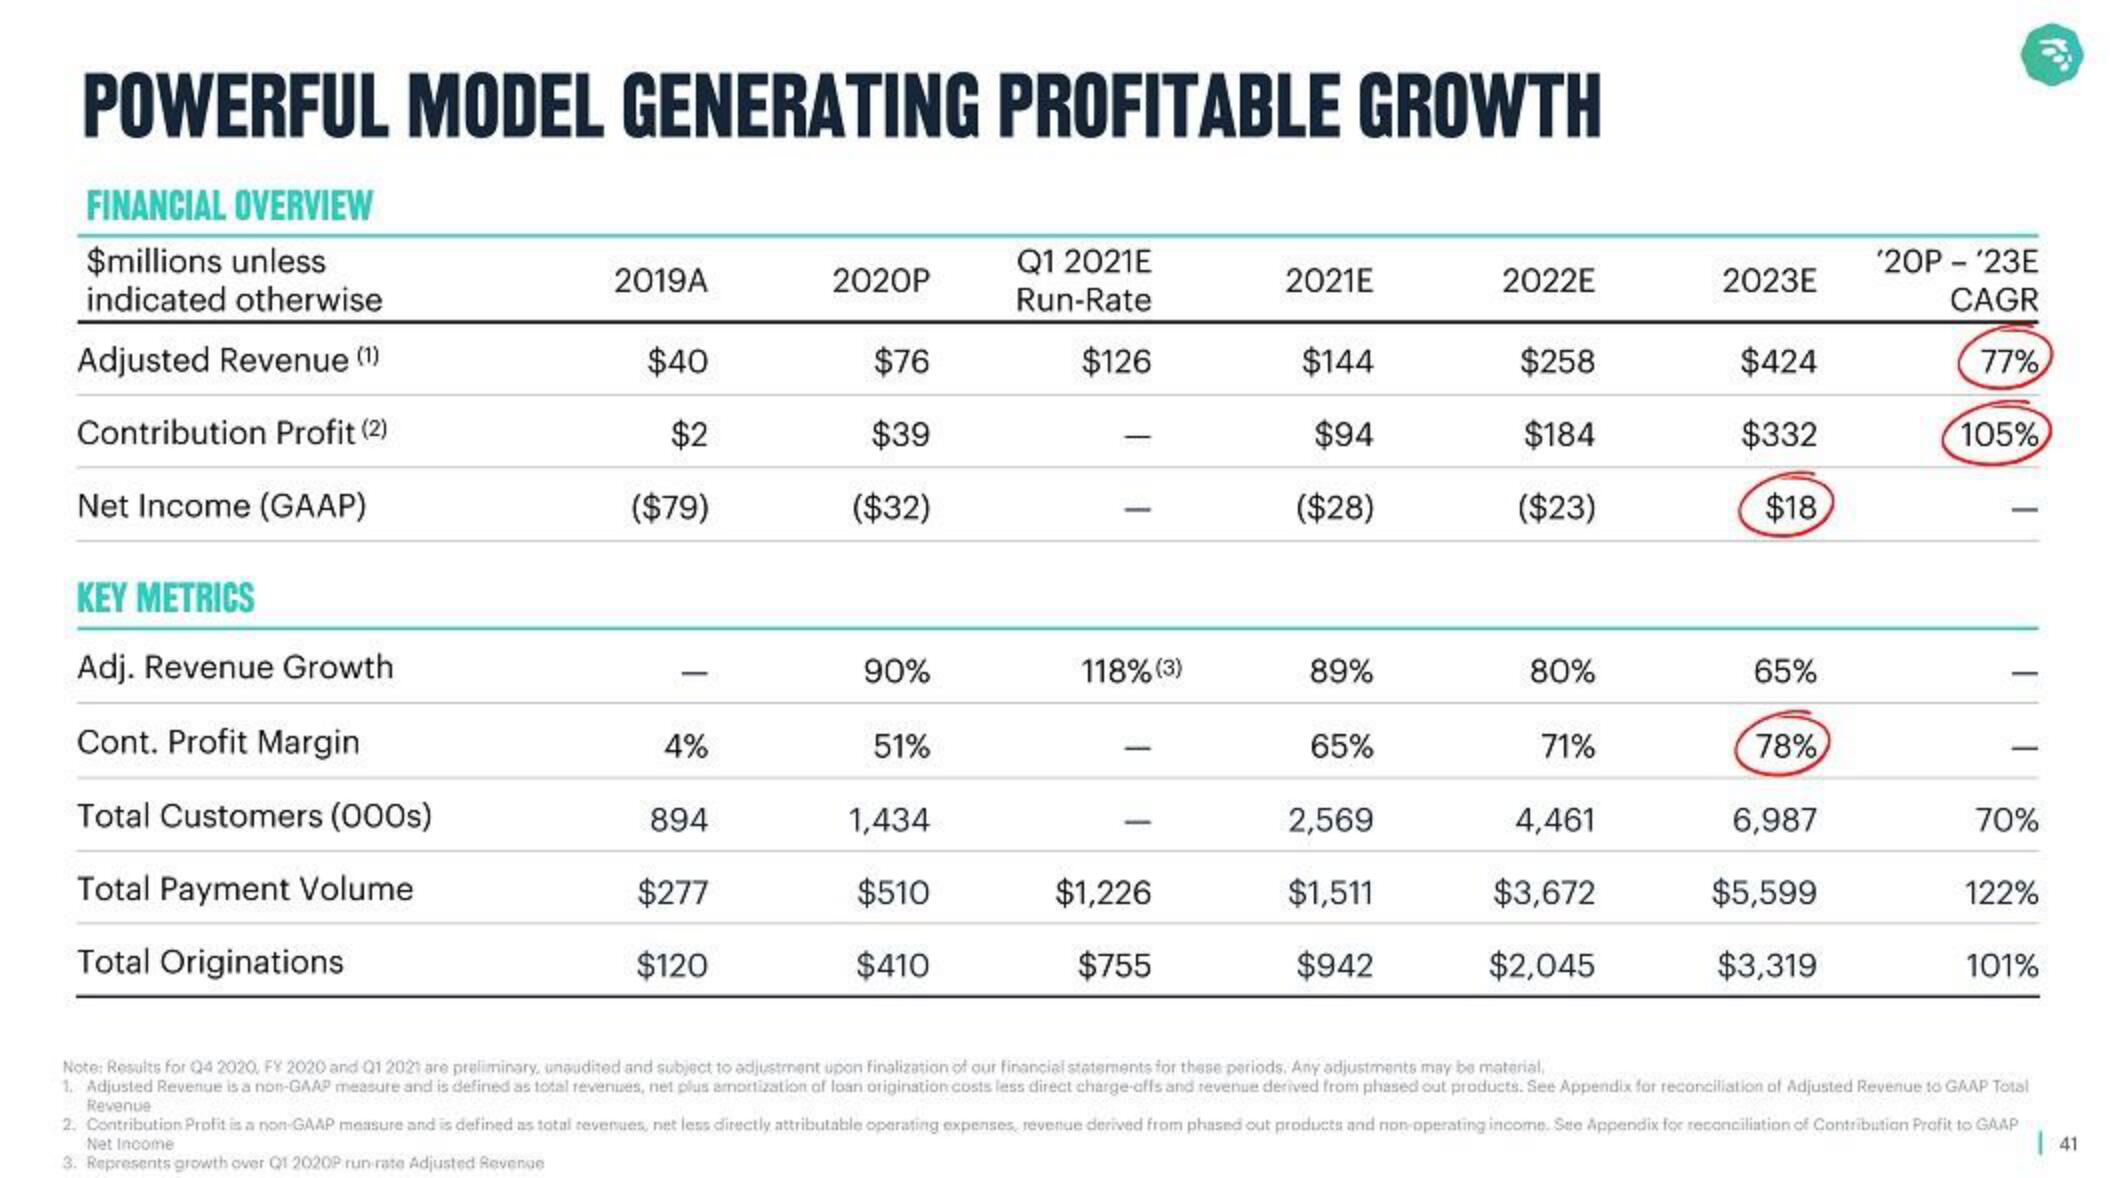
POWERFUL MODEL GENERATING PROFITABLE GROWTH
FINANCIAL OVERVIEW
$millions unless
indicated otherwise
Adjusted Revenue (1)
Contribution Profit (2)
Net Income (GAAP)
KEY METRICS
Adj. Revenue Growth
Cont. Profit Margin
Total Customers (000s)
Total Payment Volume
Total Originations
2019A
$40
$2
($79)
4%
894
$277
$120
2020P
$76
$39
($32)
90%
51%
1,434
$510
$410
Q1 2021E
Run-Rate
$126
118% (3)
$1,226
$755
2021E
$144
$94
($28)
89%
65%
2,569
$1,511
$942
2022E
$258
$184
($23)
80%
71%
4,461
$3,672
$2,045
2023E
$424
$332
$18
65%
78%
6,987
$5,599
$3,319
'20P - '23E
CAGR
77%
105%
70%
122%
101%
Note: Results for Q4 2020, FY 2020 and Q1 2021 are preliminary, unaudited and subject to adjustment upon finalization of our financial statements for these periods. Any adjustments may be material,
1. Adjusted Revenue is a non-GAAP measure and is defined as total revenues, net plus amortization of loan origination costs less direct charge-affs and revenue derived from phased out products. See Appendix for reconciliation of Adjusted Revenue to GAAP Total
Revenue
ll
2. Contribution Profit is a non-GAAP measure and is defined as total revenues, net less directly attributable operating expenses, revenue derived from phased out products and non-operating income. See Appendix for reconciliation of Contribution Profit to GAAP
Net Income
| 41
3. Represents growth over Q1 2020P run rate Adjusted RevengeView entire presentation