dLocal Results Presentation Deck
d
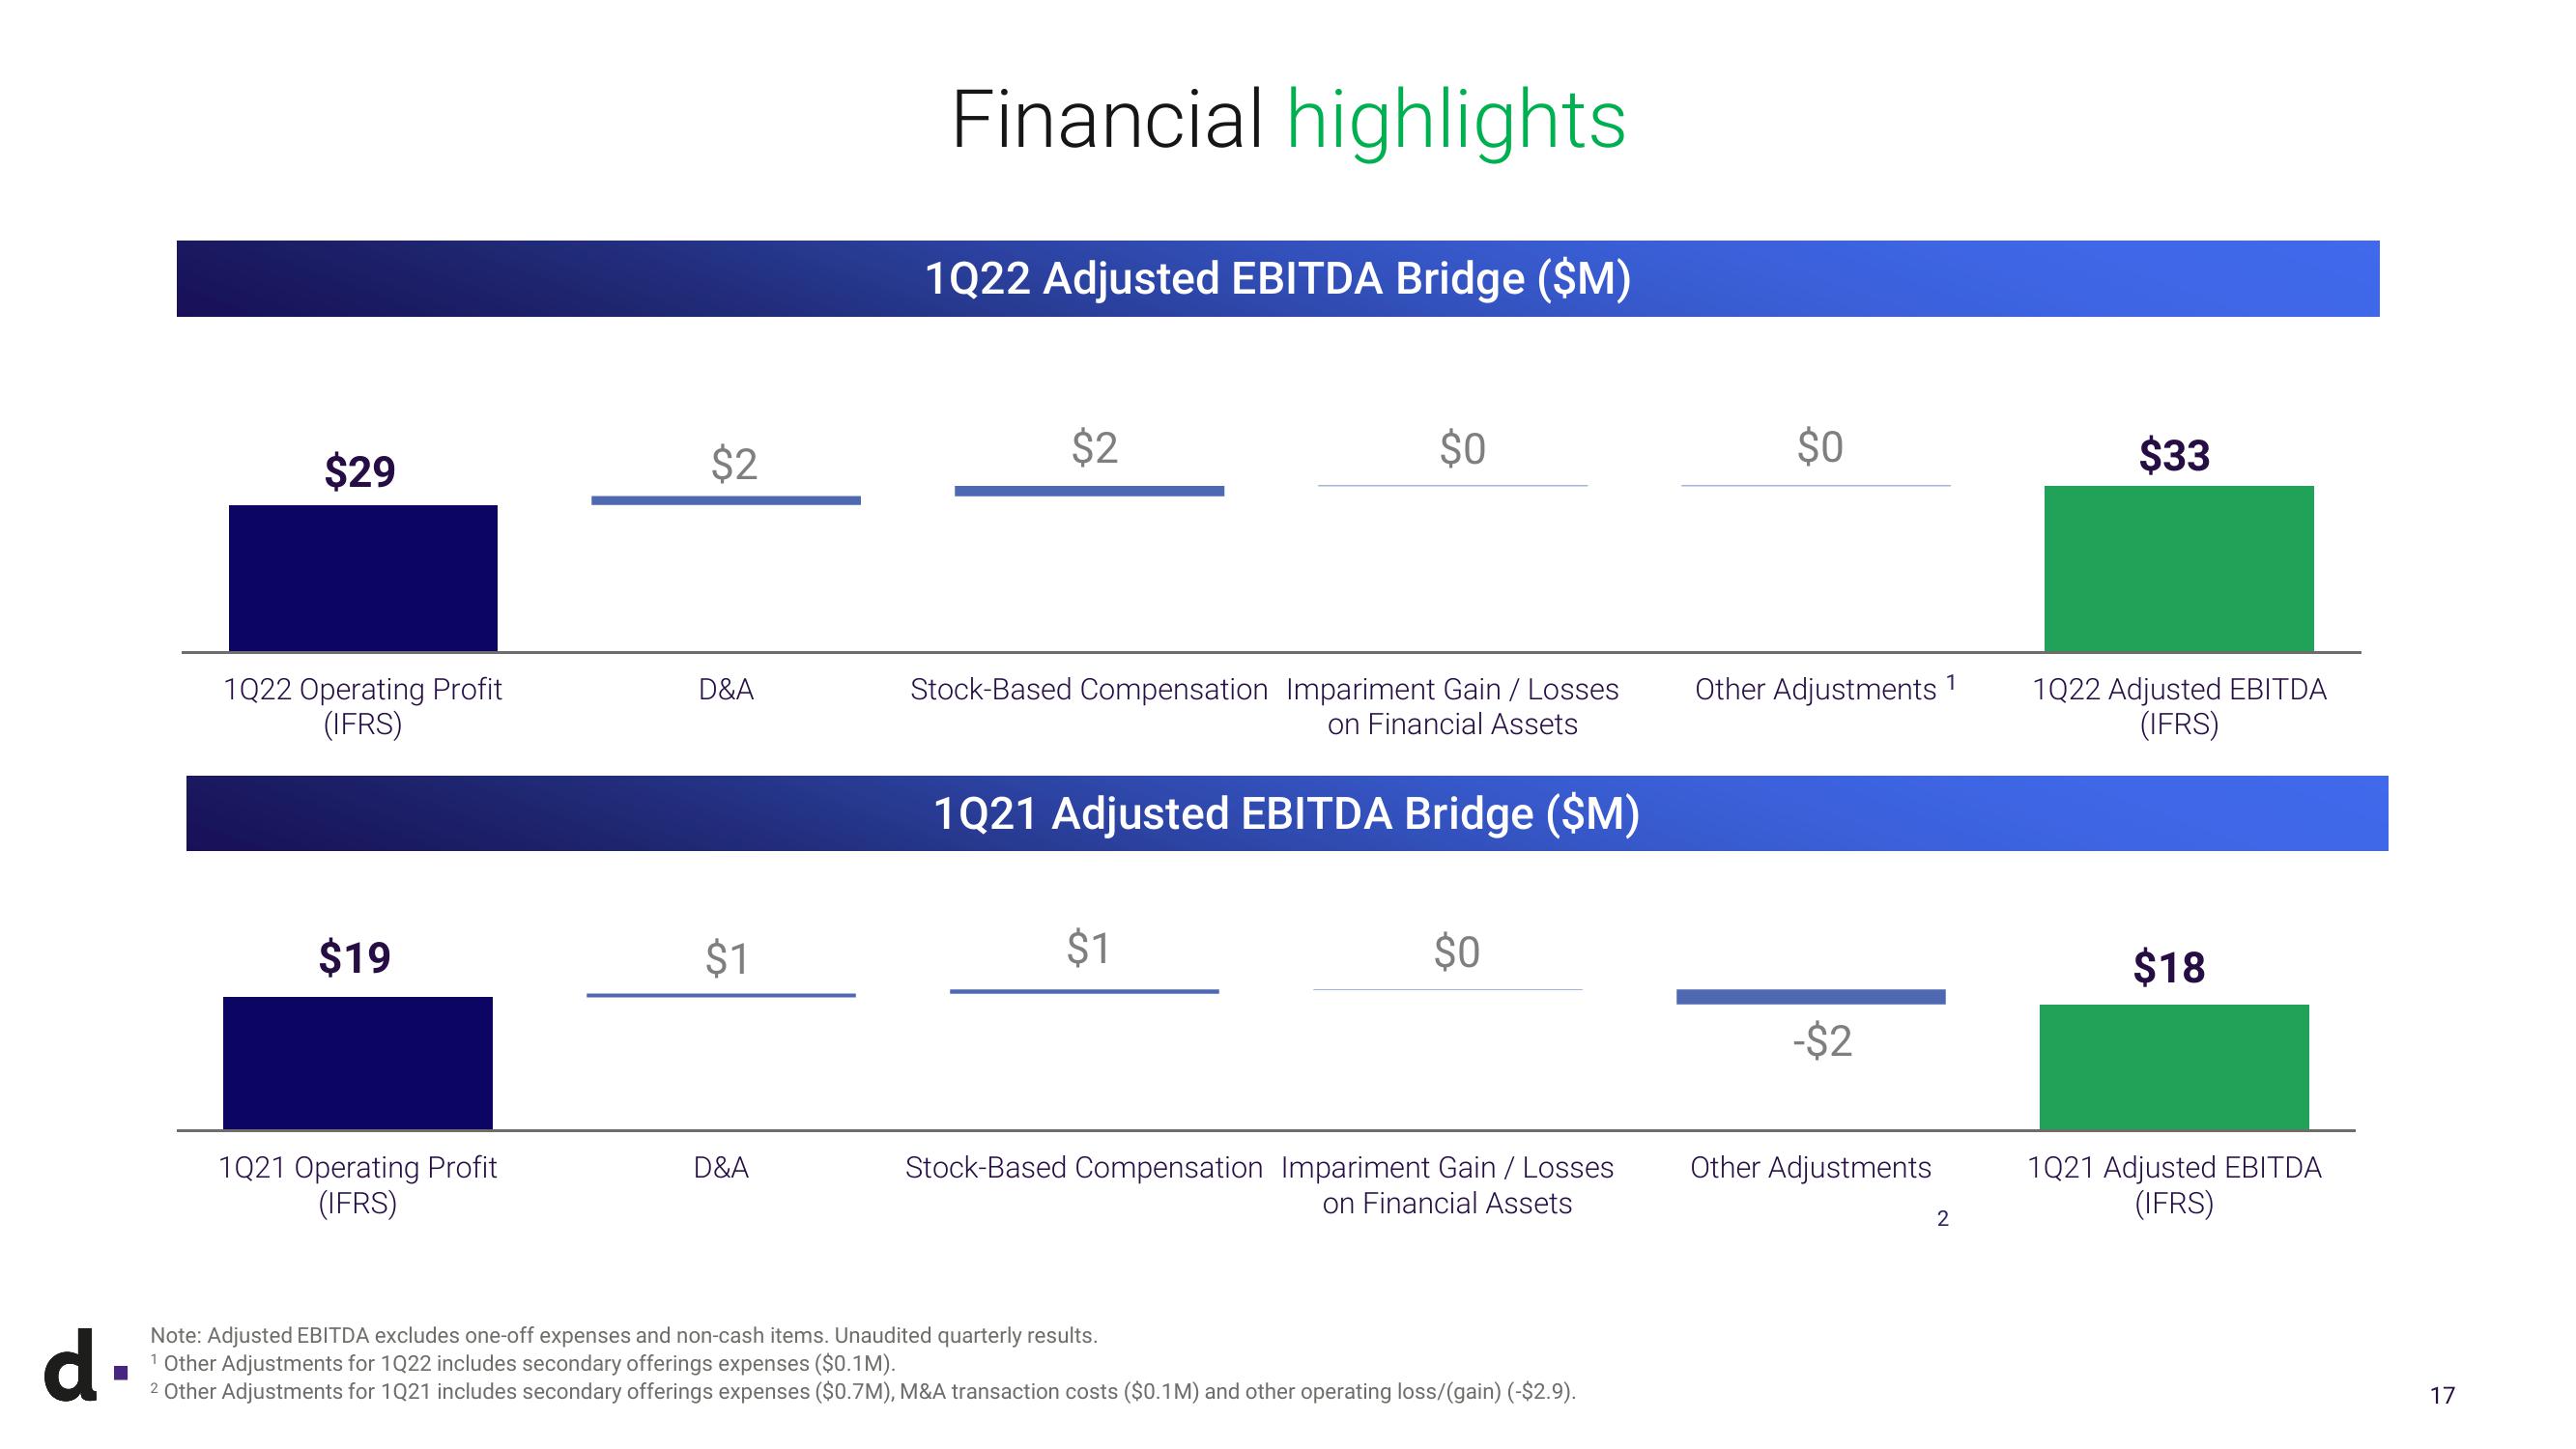
$29
1Q22 Operating Profit
(IFRS)
$19
1Q21 Operating Profit
(IFRS)
$2
D&A
$1
D&A
Financial highlights
1Q22 Adjusted EBITDA Bridge ($M)
$2
$0
Stock-Based Compensation Impariment Gain / Losses
on Financial Assets
1Q21 Adjusted EBITDA Bridge ($M)
$1
$0
Stock-Based Compensation Impariment Gain / Losses
on Financial Assets
Note: Adjusted EBITDA excludes one-off expenses and non-cash items. Unaudited quarterly results.
1 Other Adjustments for 1022 includes secondary offerings expenses ($0.1M).
2 Other Adjustments for 1021 includes secondary offerings expenses ($0.7M), M&A transaction costs ($0.1M) and other operating loss/(gain) (-$2.9).
$0
Other Adjustments
-$2
Other Adjustments
1
2
$33
1Q22 Adjusted EBITDA
(IFRS)
$18
1021 Adjusted EBITDA
(IFRS)
17View entire presentation