Avantor Results Presentation Deck
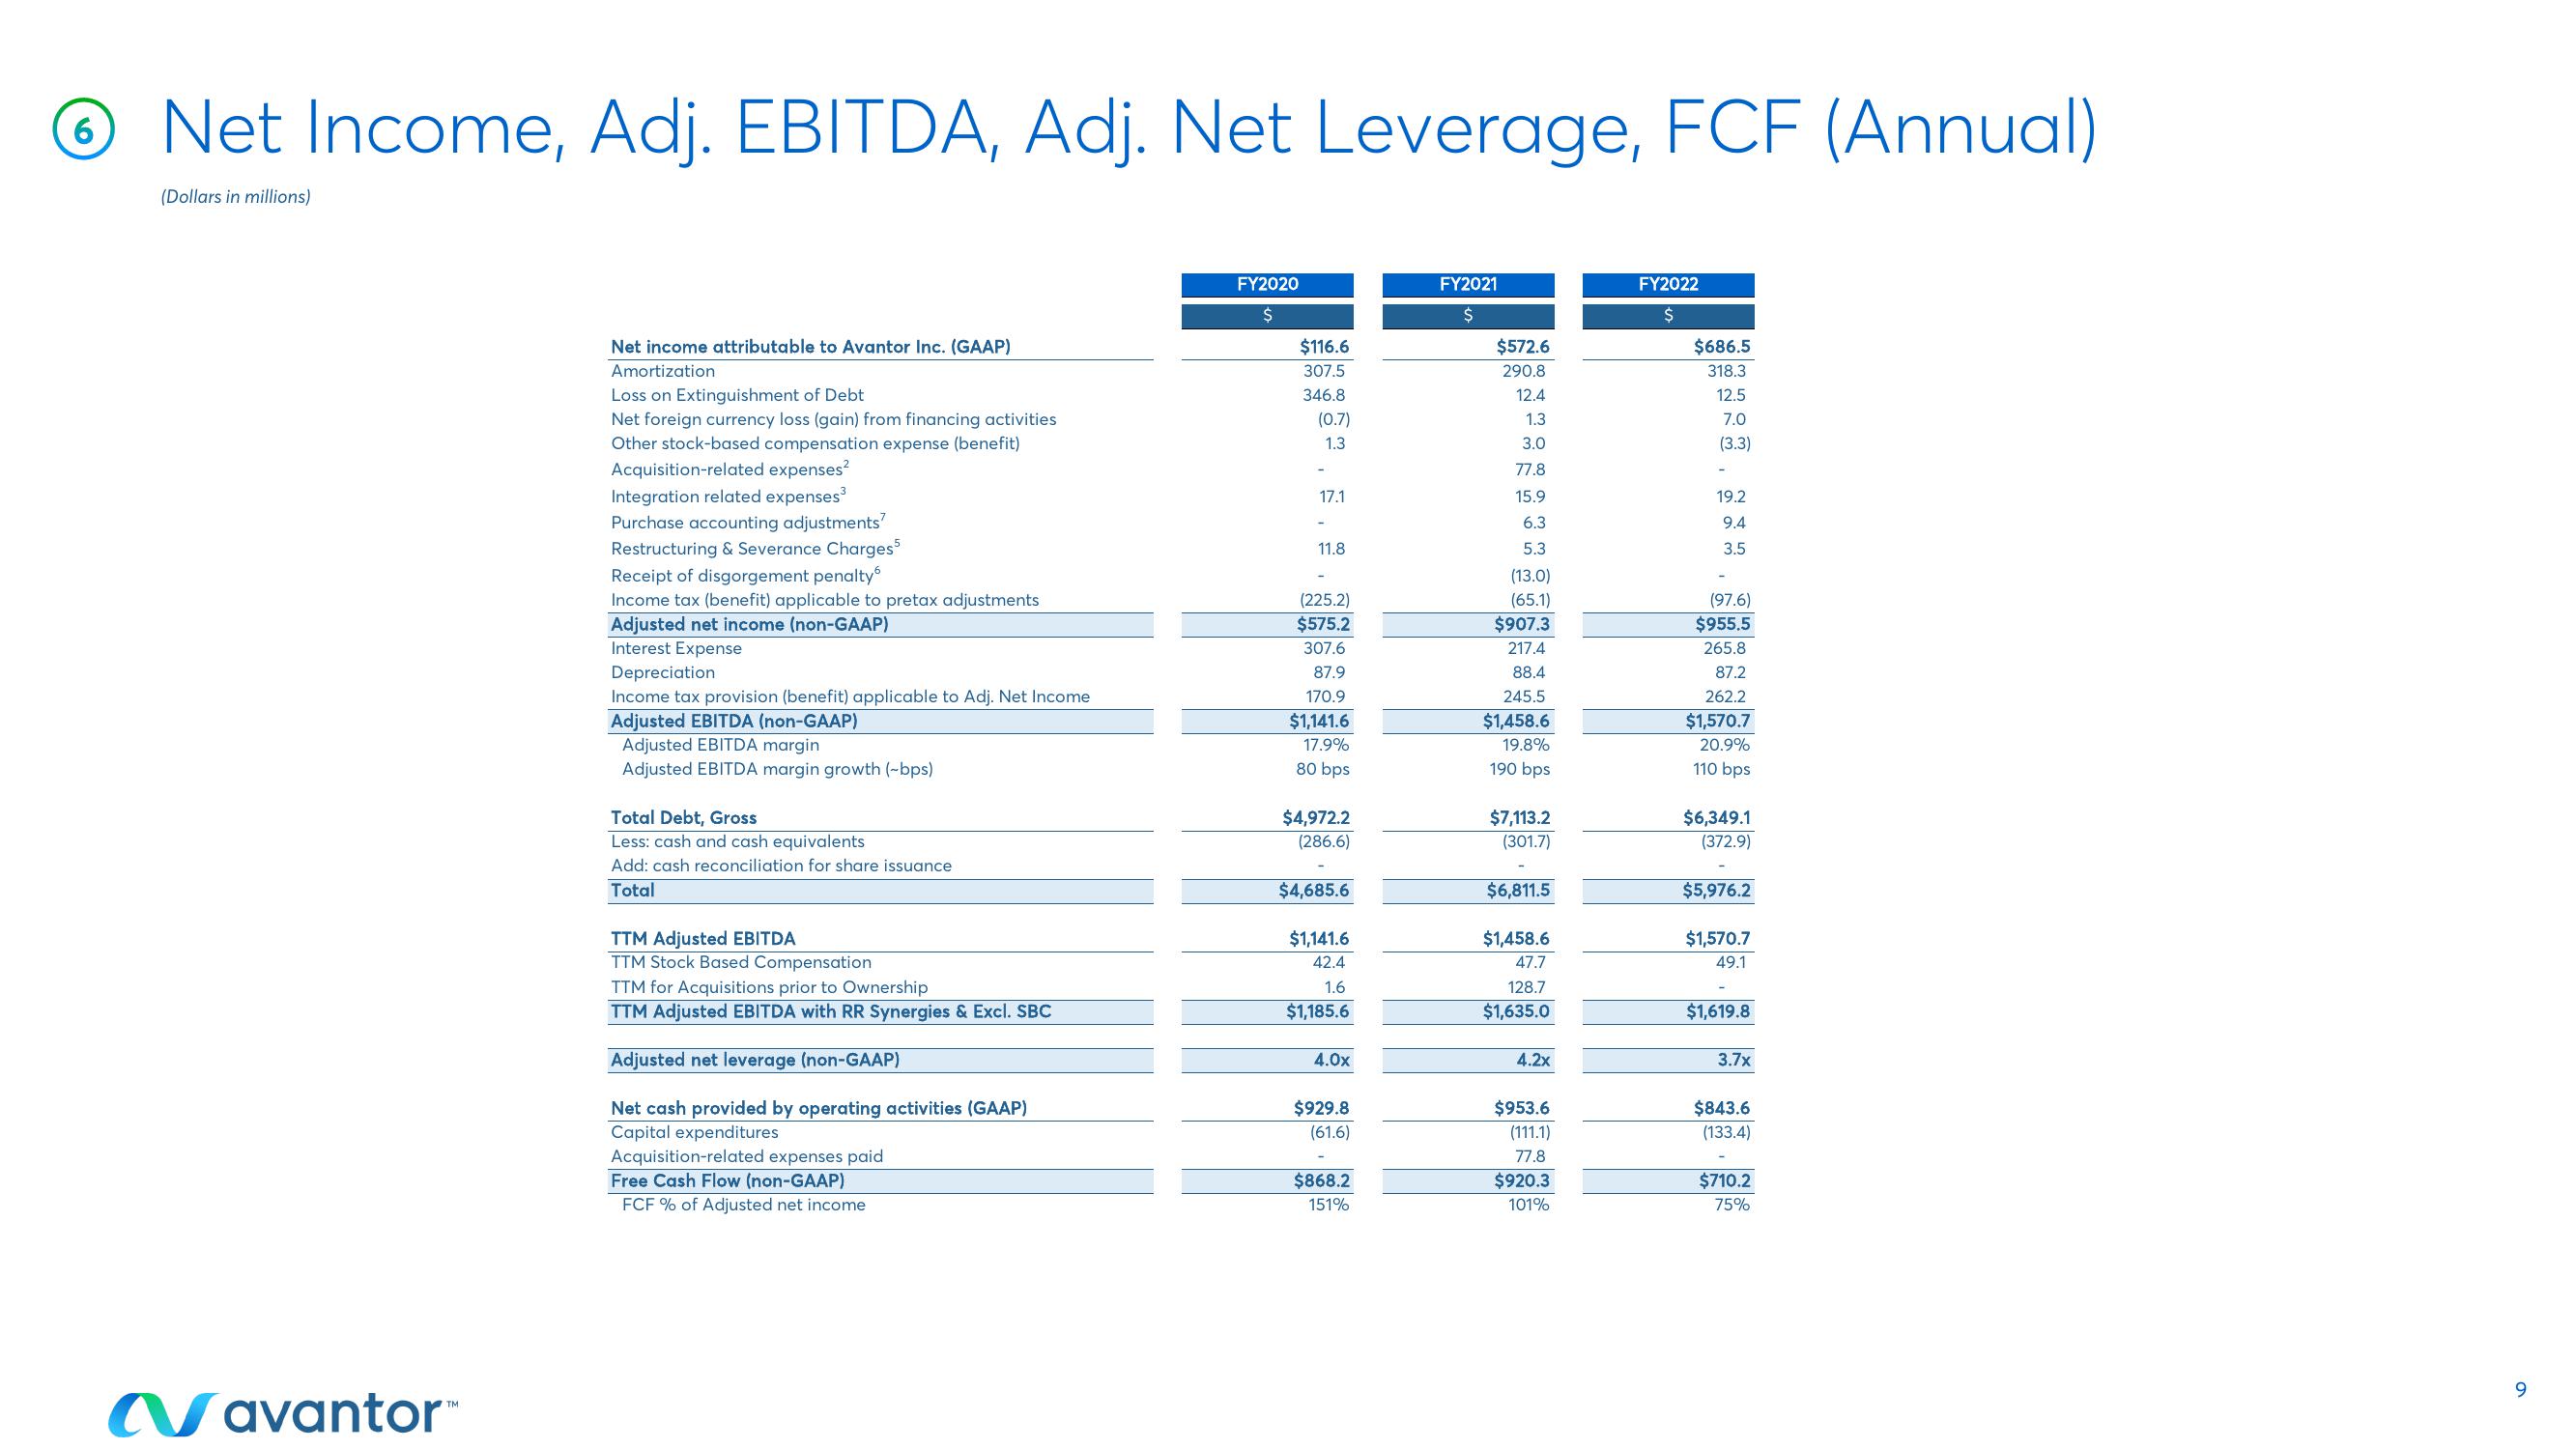
6 Net Income, Adj. EBITDA, Adj. Net Leverage, FCF (Annual)
(Dollars in millions)
Navantor™
Net income attributable to Avantor Inc. (GAAP)
Amortization
Loss on Extinguishment of Debt
Net foreign currency loss (gain) from financing activities
Other stock-based compensation expense (benefit)
Acquisition-related expenses²
Integration related expenses³
Purchase accounting adjustments'
Restructuring & Severance Charges5
Receipt of disgorgement penalty
Income tax (benefit) applicable to pretax adjustments
Adjusted net income (non-GAAP)
Interest Expense
Depreciation
Income tax provision (benefit) applicable to Adj. Net Income
Adjusted EBITDA (non-GAAP)
Adjusted EBITDA margin
Adjusted EBITDA margin growth (-bps)
Total Debt, Gross
Less: cash and cash equivalents
Add: cash reconciliation for share issuance
Total
TTM Adjusted EBITDA
TTM Stock Based Compensation
TTM for Acquisitions prior to Ownership
TTM Adjusted EBITDA with RR Synergies & Excl. SBC
Adjusted net leverage (non-GAAP)
Net cash provided by operating activities (GAAP)
Capital expenditures
Acquisition-related expenses paid
Free Cash Flow (non-GAAP)
FCF % of Adjusted net income
FY2020
$
$116.6
307.5
346.8
(0.7)
1.3
-
17.1
11.8
(225.2)
$575.2
307.6
87.9
170.9
$1,141.6
17.9%
80 bps
$4,972.2
(286.6)
$4,685.6
$1,141.6
42.4
1.6
$1,185.6
4.0x
$929.8
(61.6)
$868.2
151%
FY2021
$
$572.6
290.8
12.4
1.3
3.0
77.8
15.9
6.3
5.3
(13.0)
(65.1)
$907.3
217.4
88.4
245.5
$1,458.6
19.8%
190 bps
$7,113.2
(301.7)
$6,811.5
$1,458.6
47.7
128.7
$1,635.0
4.2x
$953.6
(111.1)
77.8
$920.3
101%
FY2022
$
$686.5
318.3
12.5
7.0
(3.3)
19.2
9.4
3.5
(97.6)
$955.5
265.8
87.2
262.2
$1,570.7
20.9%
110 bps
$6,349.1
(372.9)
$5,976.2
$1,570.7
49.1
$1,619.8
3.7x
$843.6
(133.4)
$710.2
75%
9View entire presentation