Newsight Imaging SPAC Presentation Deck
Revenue
Multiple
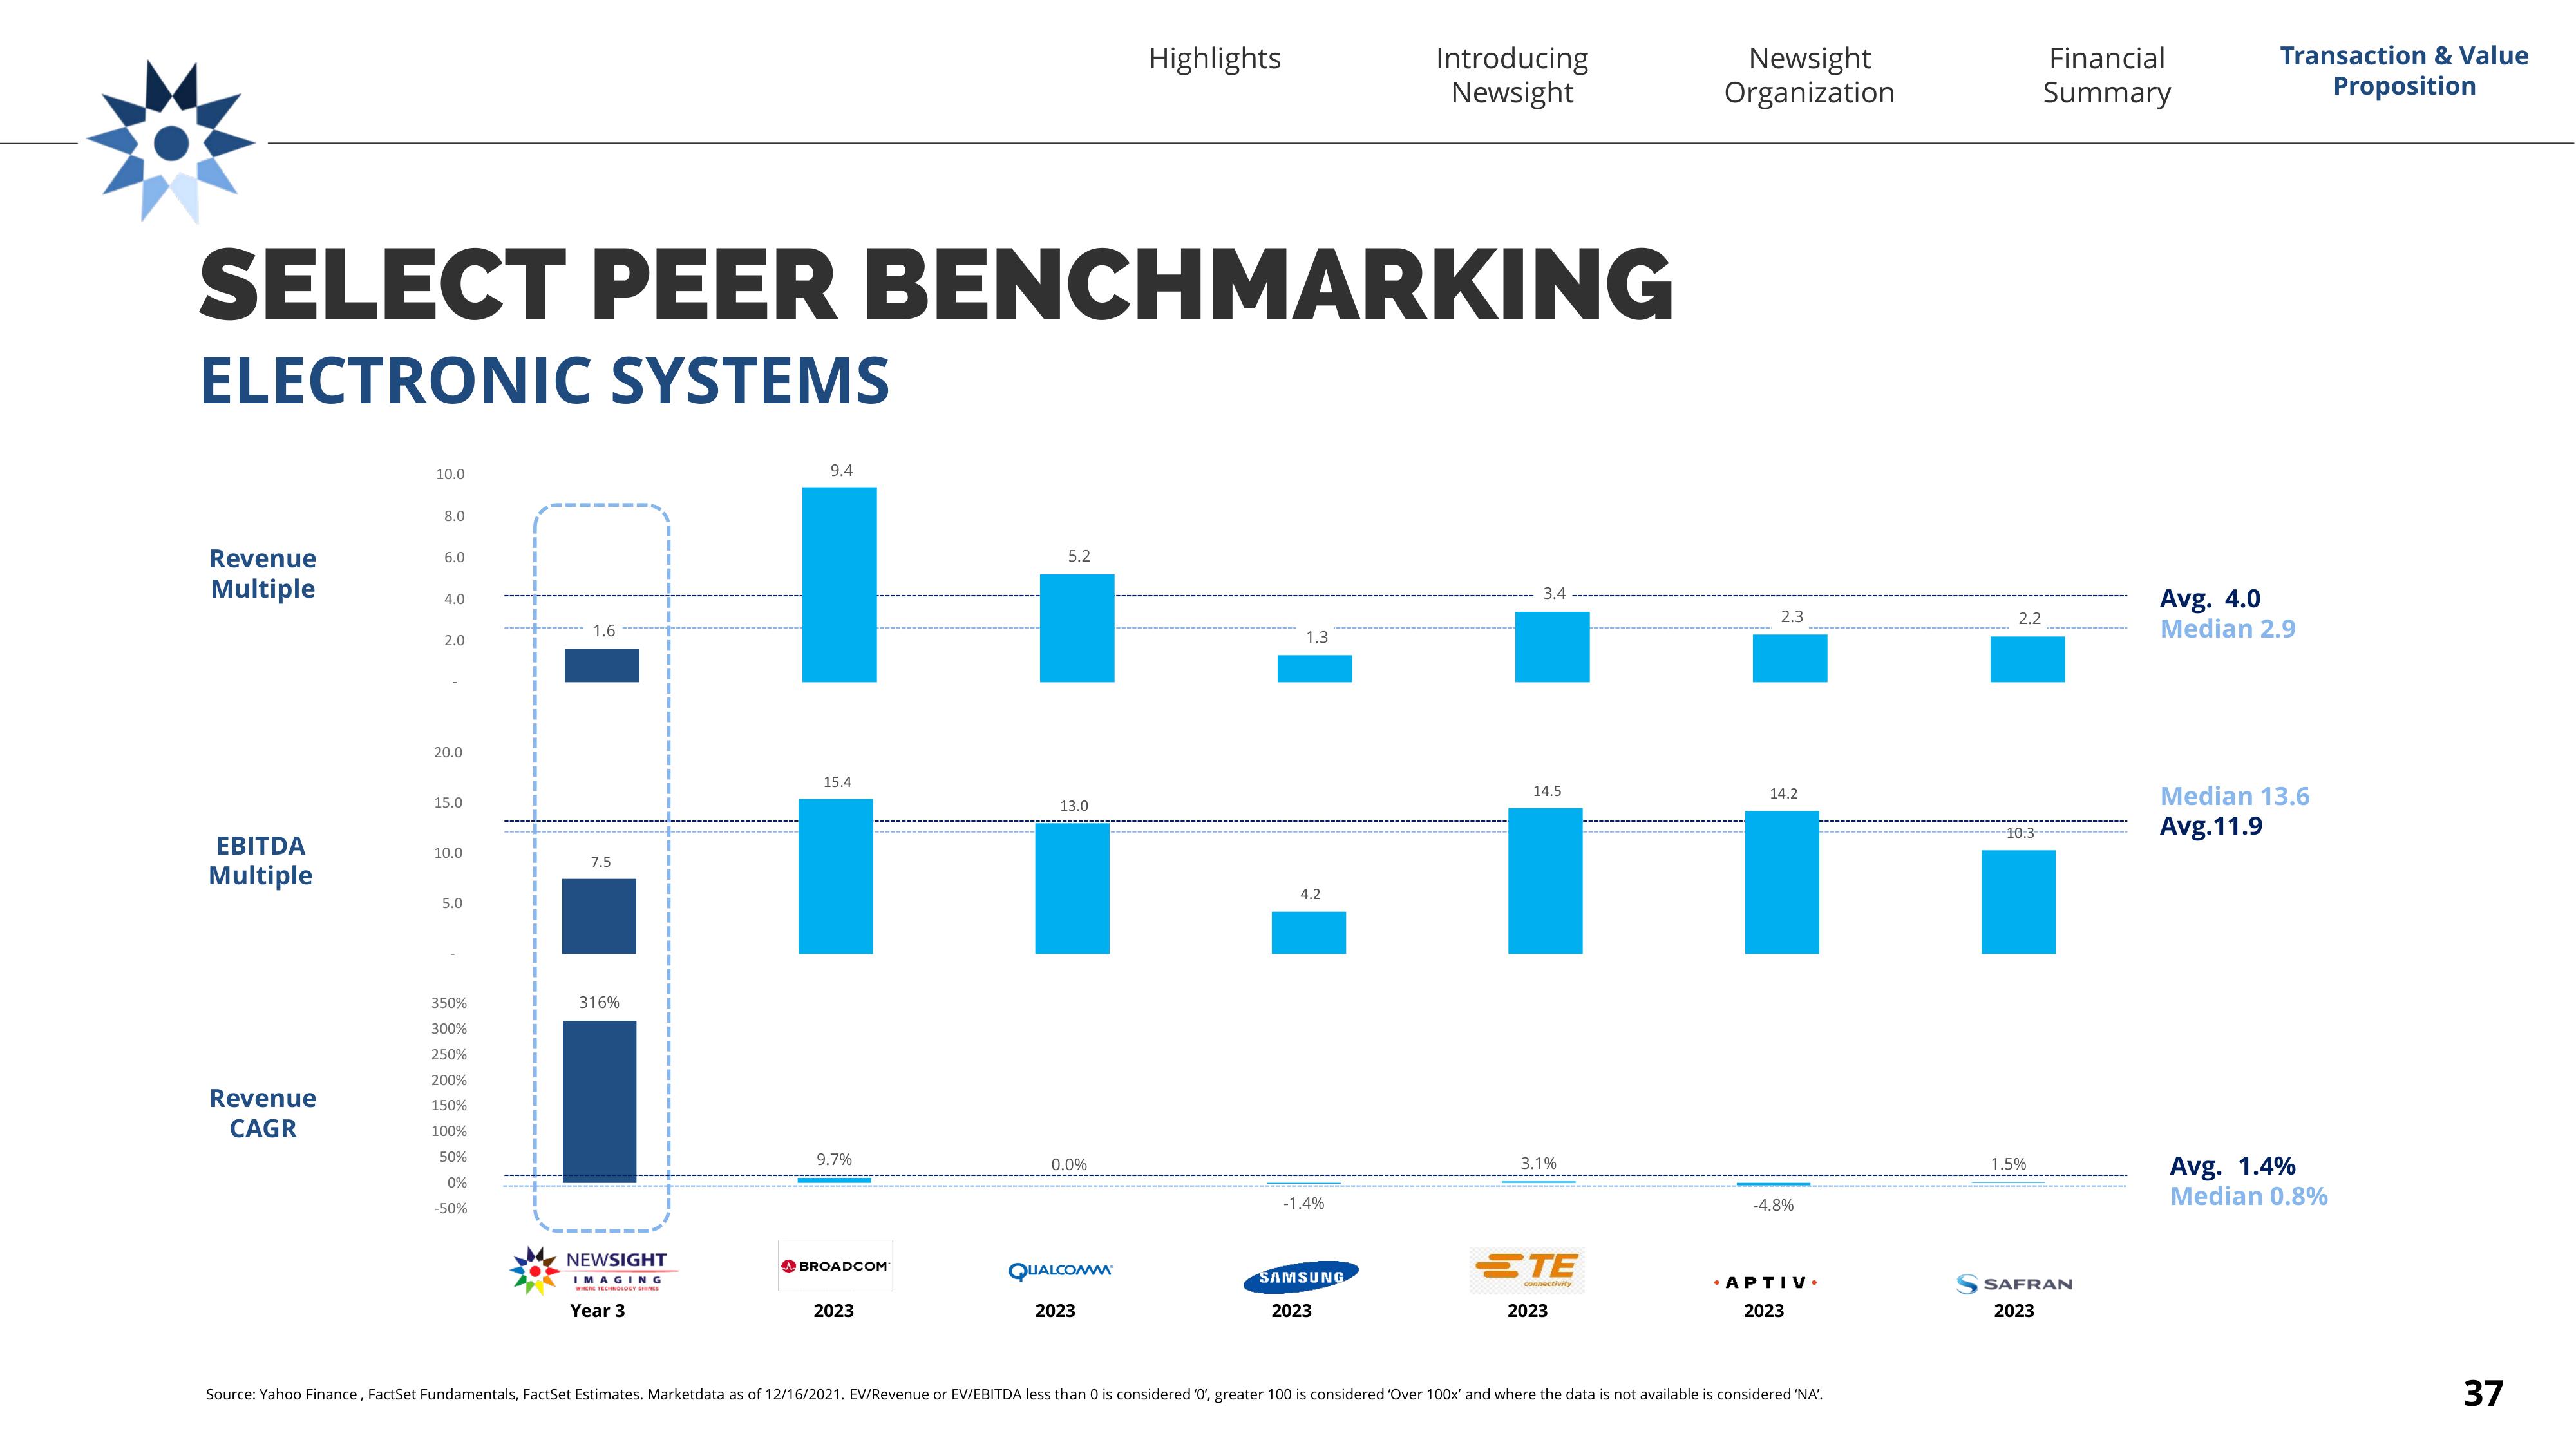
SELECT PEER BENCHMARKING
ELECTRONIC SYSTEMS
EBITDA
Multiple
Revenue
CAGR
10.0
8.0
6.0
4.0
2.0
20.0
15.0
10.0
5.0
350%
300%
250%
200%
150%
100%
50%
0%
-50%
1.6
7.5
316%
NEWSIGHT
IMAGING
Year 3
9.4
15.4
9.7%
BROADCOM
2023
5.2
13.0
0.0%
QUALCOMM
Highlights
2023
1.3
4.2
-1.4%
Introducing
Newsight
SAMSUNG
2023
3.4
14.5
3.1%
STE
2023
Newsight
Organization
2.3
14.2
-4.8%
.APTIV.
2023
Source: Yahoo Finance, FactSet Fundamentals, FactSet Estimates. Marketdata as of 12/16/2021. EV/Revenue or EV/EBITDA less than 0 is considered '0', greater 100 is considered 'Over 100x' and where the data is not available is considered 'NA'.
2.2
10:3
Financial
Summary
1.5%
SAFRAN
2023
Transaction & Value
Proposition
Avg. 4.0
Median 2.9
Median 13.6
Avg.11.9
Avg. 1.4%
Median 0.8%
37View entire presentation