First Merchants Results Presentation Deck
Asset Quality
Asset Quality Trends ($M)
1. Non-Accrual Loans
2. Other Real Estate
3. 90PD Loans
4. Renegotiated Loans
5. NPAS + 90PD
6. NPAS + 90PD/Loans
and ORE
7. Classified Loans
8. Classified Loans/Loans
9. Net Charge-offs (QTD)
10. QTD NCO/Avg. Loans
(Annualized)
4Q22
$ 42.3
6.5
1.7
0.2
1Q23 2Q23 3Q23 4Q23
$ 46.6 $ 69.2 $ 53.1 $ 53.6
7.8
7.0
7.7
0.4
6.5
0.1
4.8
First Merchants Corporation
Helping you prosper
0.2
$ 50.7 $ 61.4 $ 77.3 $59.7 $ 58.6
0.42% 0.50% 0.63% 0.49% 0.47%
$ 215.2 $ 250.5 $ 257.0 $ 232.2 $ 242.8
1.79% 2.04% 2.09% 1.89% 1.94%
$ 3.4 $ 0.2 $ 1.9 $ 20.4 $ 3.1
0.12% 0.01% 0.06% 0.66% 0.10%
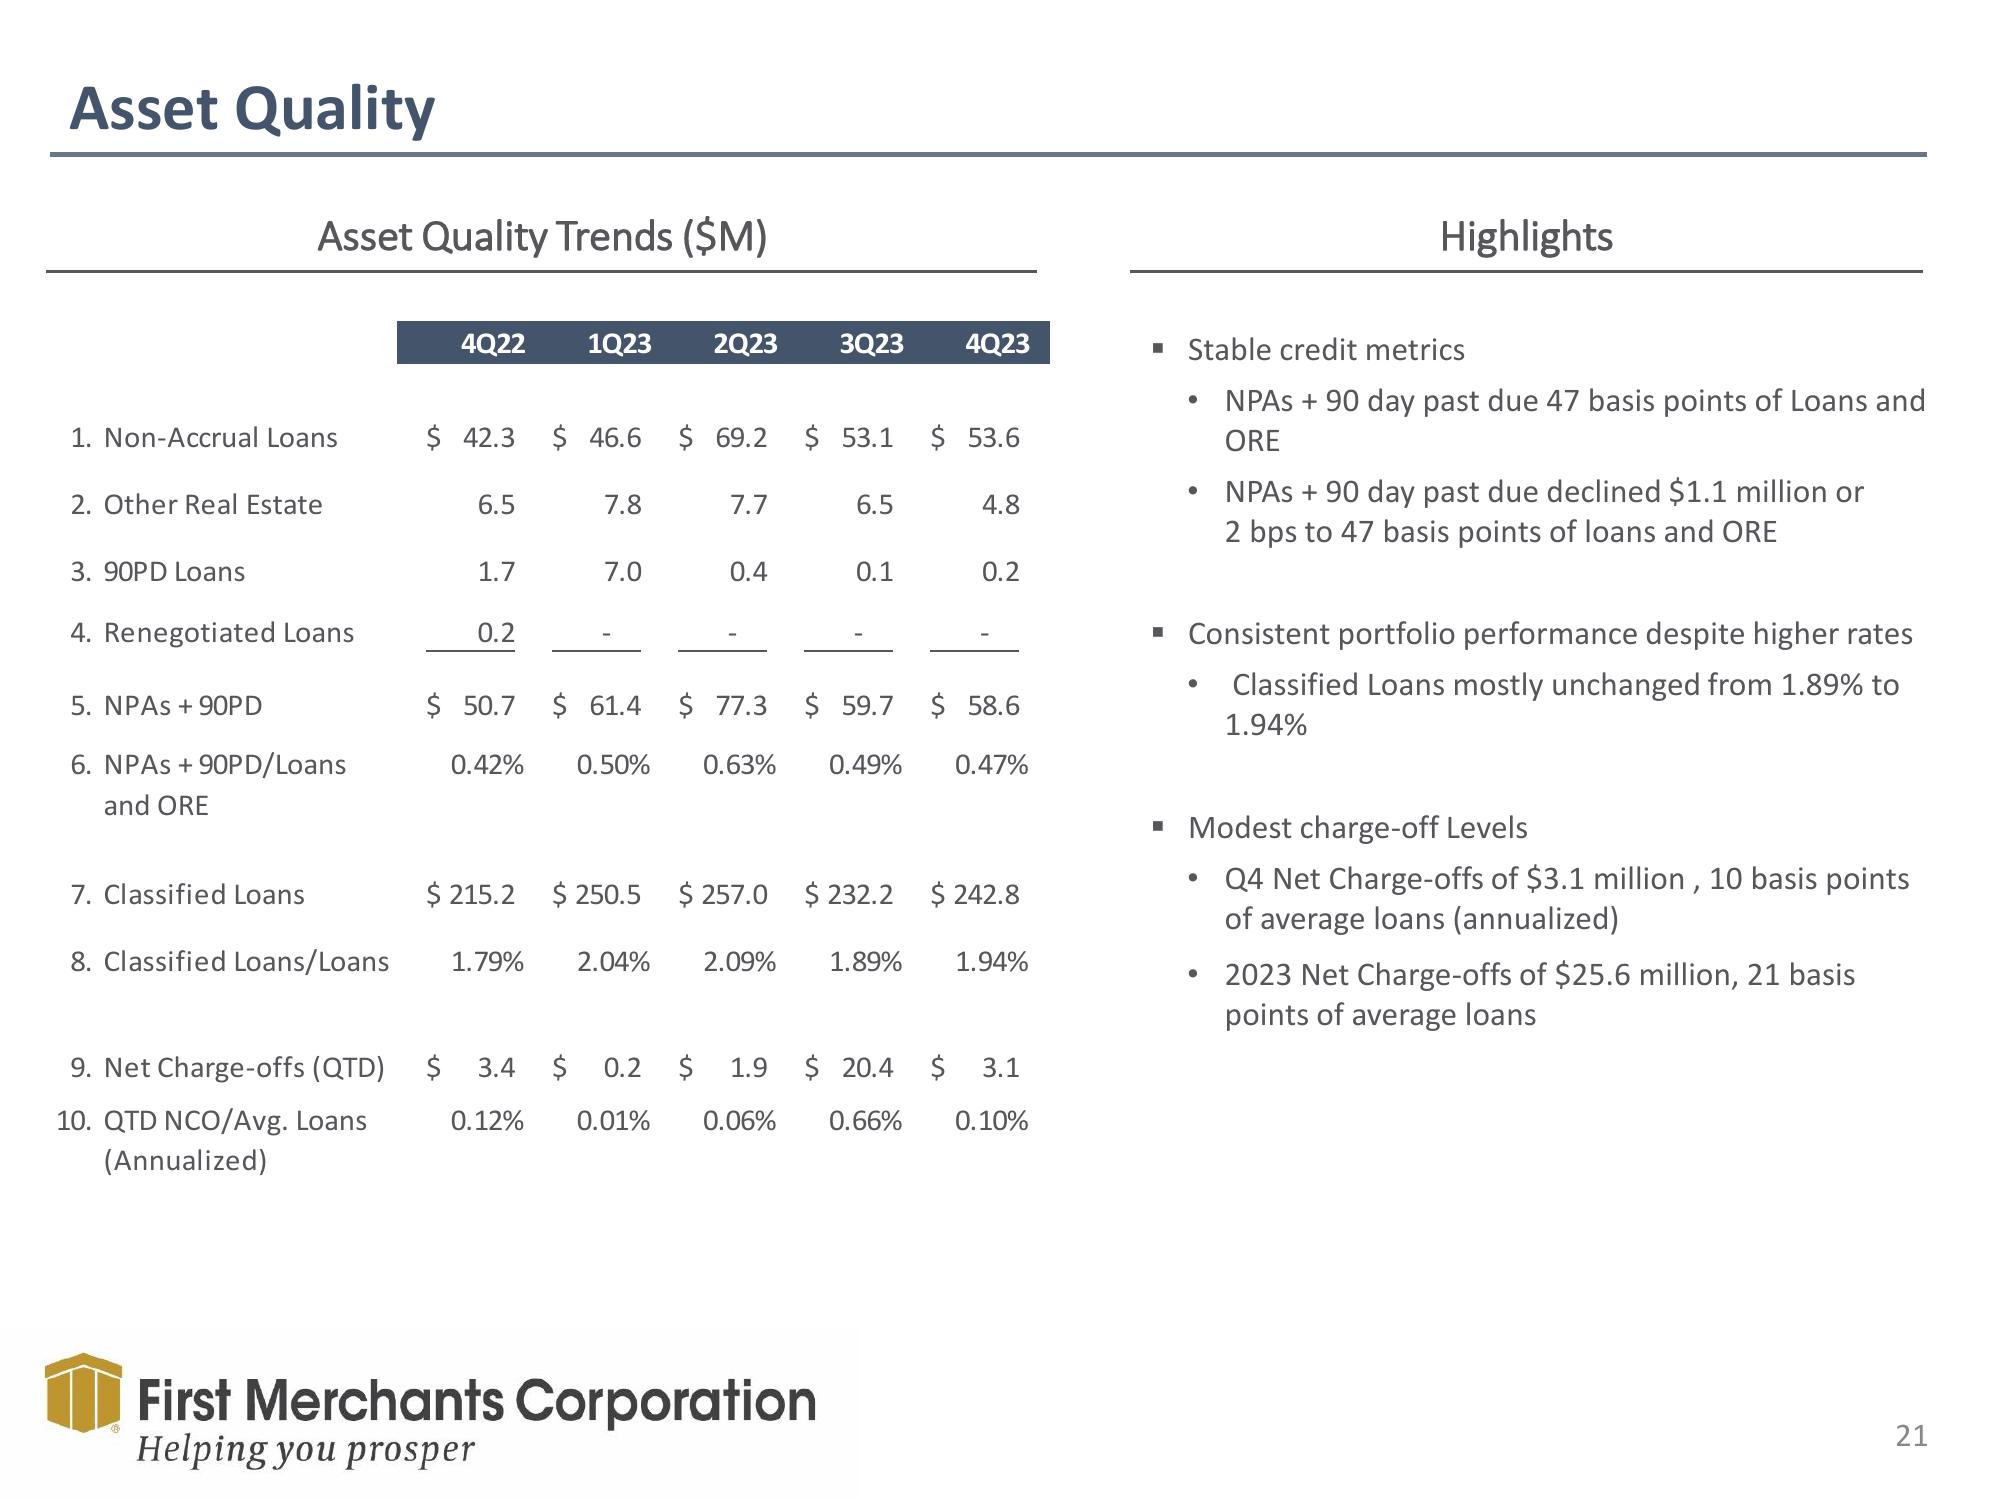
▪ Stable credit metrics
●
Highlights
●
NPAS + 90 day past due 47 basis points of Loans and
ORE
NPAS + 90 day past due declined $1.1 million or
2 bps to 47 basis points of loans and ORE
▪ Consistent portfolio performance despite higher rates
Classified Loans mostly unchanged from 1.89% to
1.94%
▪ Modest charge-off Levels
Q4 Net Charge-offs of $3.1 million, 10 basis points
of average loans (annualized)
• 2023 Net Charge-offs of $25.6 million, 21 basis
points of average loans
21View entire presentation