J.P.Morgan Investment Banking Pitch Book
APPENDIX
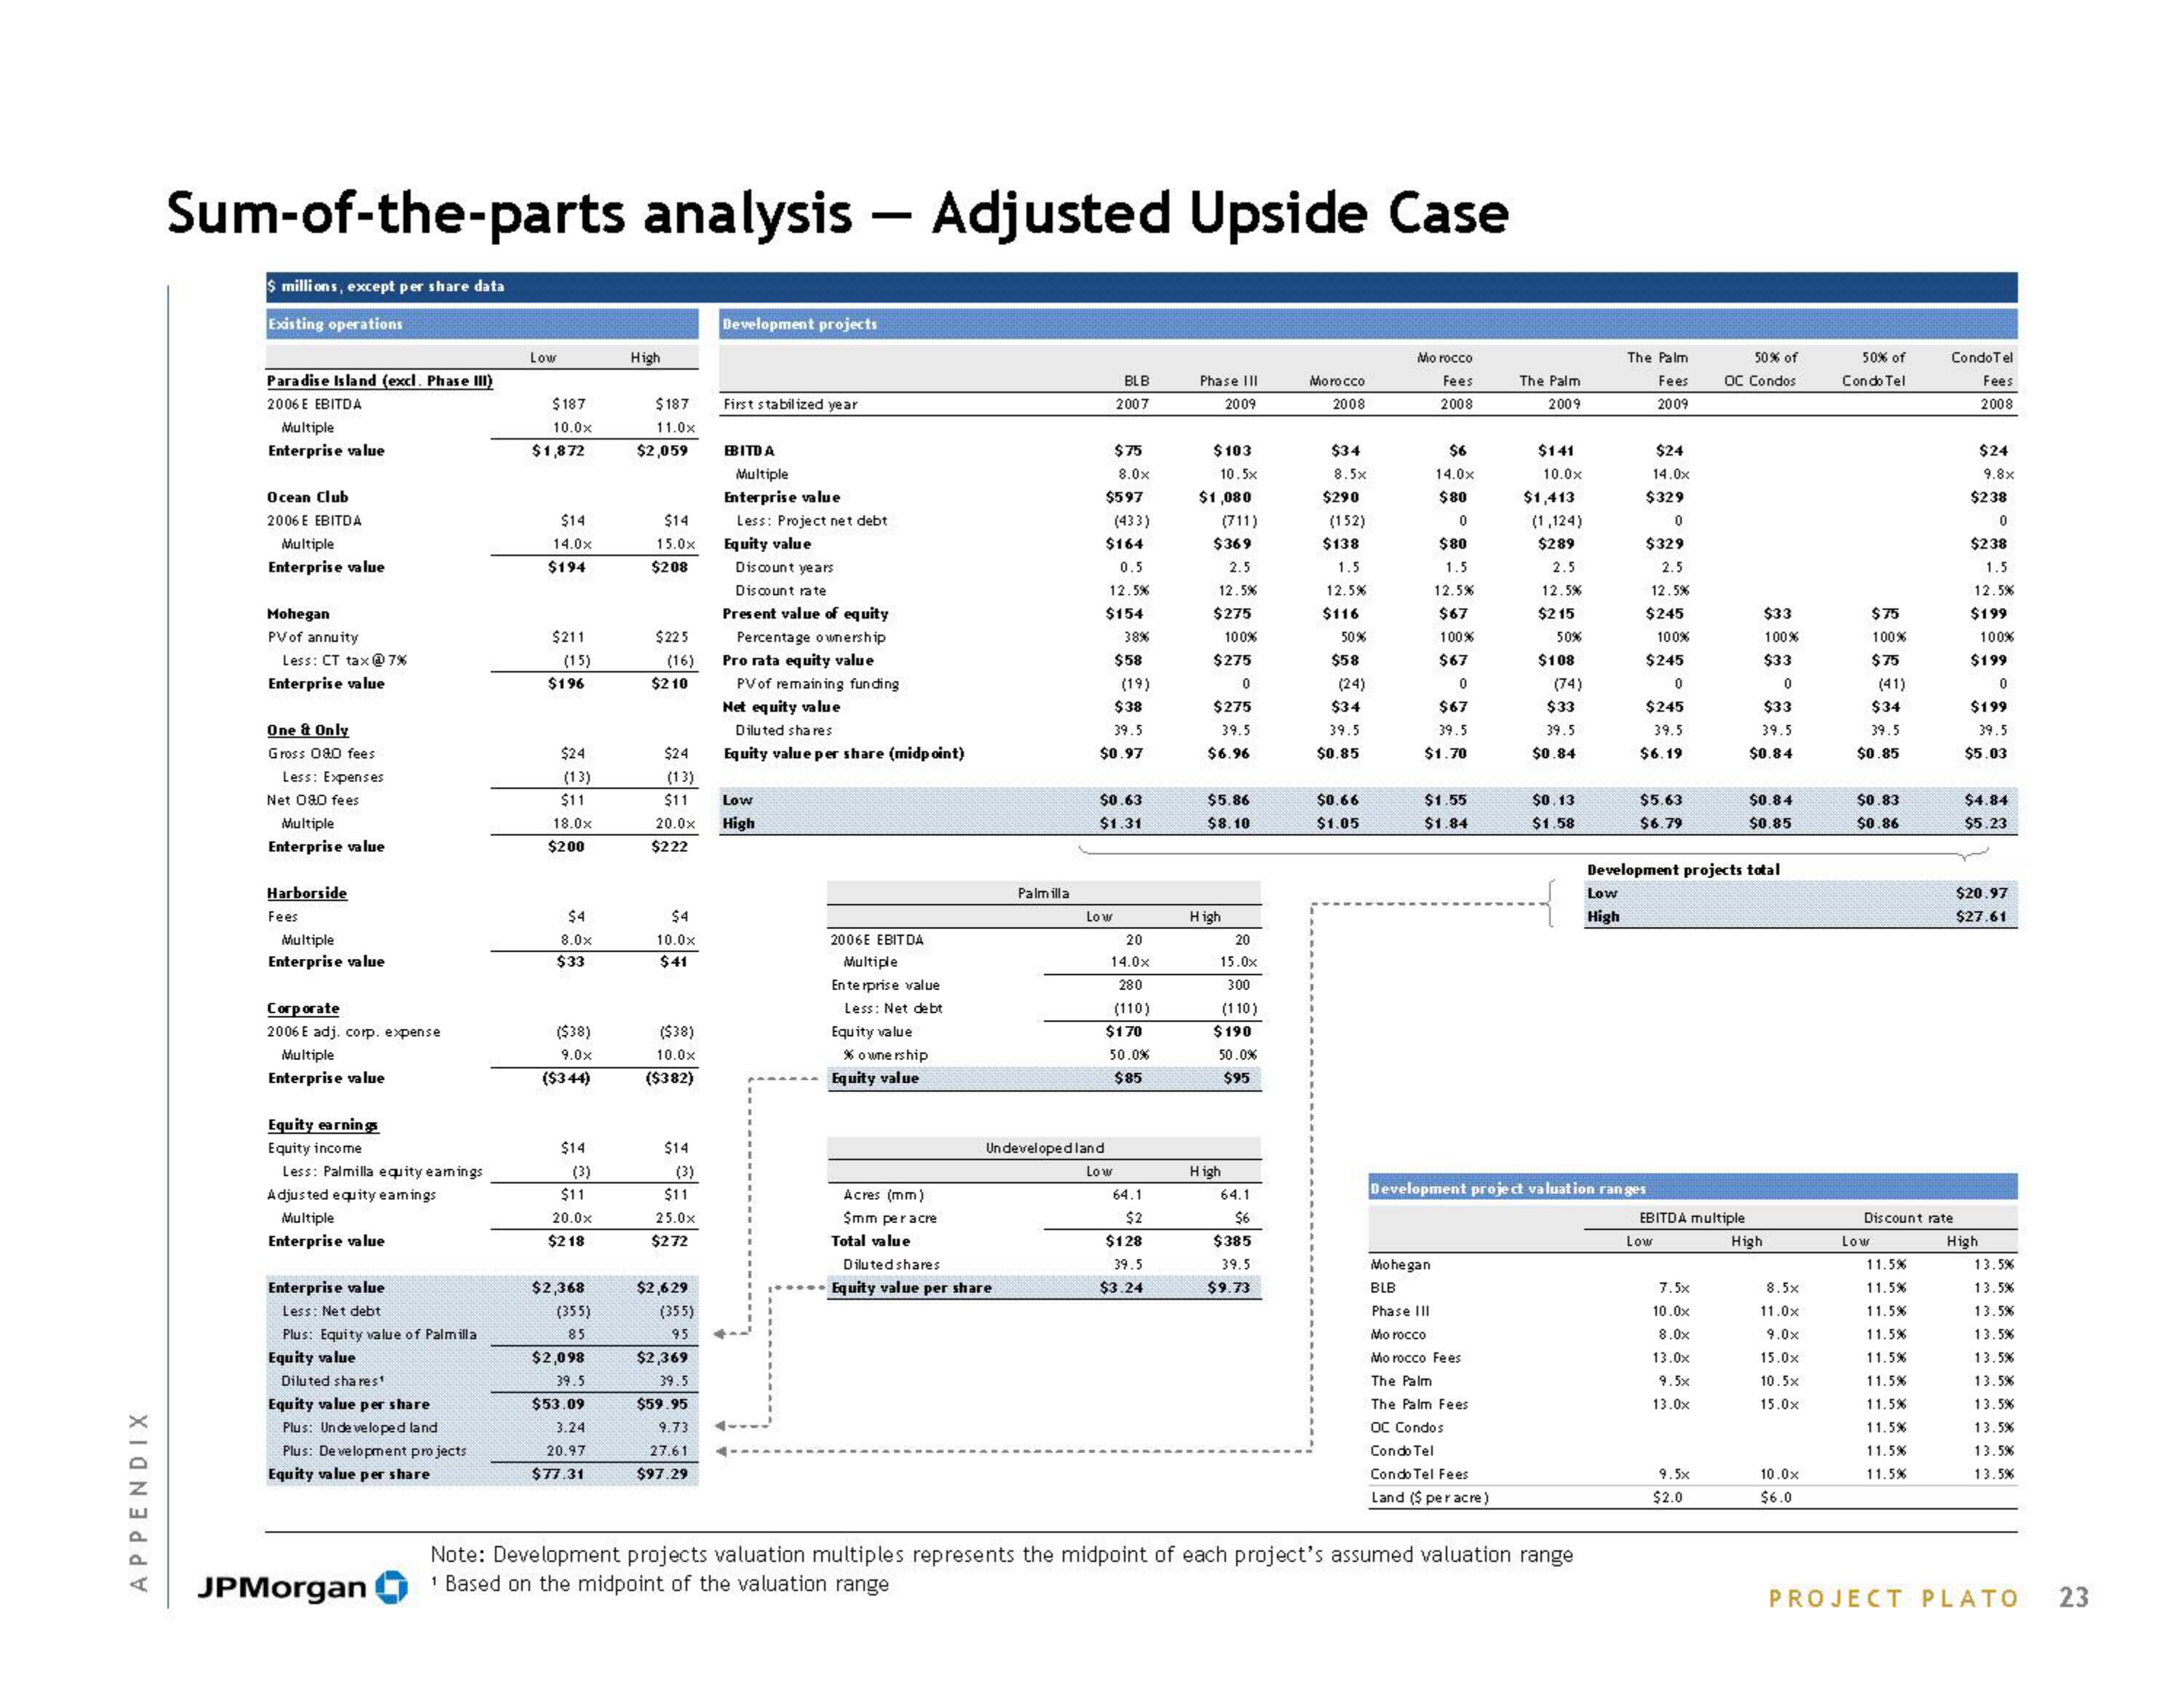
Sum-of-the-parts analysis - Adjusted Upside Case
$ millions, except per share data
Existing operations
Paradise Island (excl. Phase III)
2006 E EBITDA
Multiple
Enterprise value
Ocean Club
2006 E EBITDA
Multiple
Enterprise value
Mohegan
PV of annuity
Less: CT tax @ 7%
Enterprise value
One & Only
Gross 080 fees
Less: Expenses
Net 080 fees
Multiple
Enterprise value
Harborside
Fees
Multiple
Enterprise value
Corporate
2006 E adj. corp. expense
Multiple
Enterprise value
Equity earnings
Equity income
Less: Palmilla equity earnings
Adjusted equity earings
Multiple
Enterprise value
Enterprise value
Less: Net debt
Plus: Equity value of Palmilla
Equity value
Diluted shares¹
Equity value per share
Plus: Unde ve loped land
Plus: Development projects
Equity value per share
JPMorgan
Low
$187
10.0x
$1,872
$14
14.0x
$194
$211
(15)
$196
$24
(13)
$11
18.0x
$200
$4
8.0x
$33
($38)
9.0x
($344)
$14
(3)
$11
20.0x
$218
$2,368
(355)
85
$2,098
39.5
$53.09
3.24
20.97
$77.31
High
$187
11.0x
$2,059
$14
15.0x
$208
$225
(16)
$210
20.0x
$222
$4
10.0x
$41
($38)
10.0x
($382)
$24
(13)
$11 Low
High
$14
(3)
$11
25.0x
$272
$2,629
(355)
95
Development projects
$2,369
39.5
$59.95
9.73
27.61
$97.29
First stabilized year
EBITDA
Multiple
Enterprise value
Less: Project net debt
Equity value
Discount years
Discount rate
Present value of equity
Percentage ownership
Pro rata equity value
PV of remaining funding
Net equity value
Diluted shares
Equity value per share (midpoint)
2006E EBITDA
Multiple
Enterprise value
Less: Net debt
Equity value
% ownership
Equity value
Acres (mm)
$mm per acre
Total value
Palmilla
Diluted shares
Equity value per share
BLB
2007
$75
$597
8.0x
(433)
$164
0.5
12.5%
Low
$154
$58
(19)
$38
39.5
$0.97
38%
$0.63
$1.31
20
14.0x
280
Undeveloped land
Low
(110)
$170
50.0%
$85
64.1
$2
$128
39.5
$3.24
Phase III
2009
$103
10.5x
$1,080
(711)
$369
2.5
12.5%
$275
$275
100%
0
$275
39.5
$6.96
High
$5.86
$8.10
20
15.0x
300
(110)
$190
50.0%
$95
High
64.1
$6
$385
39.5
$9.73
Morocco
2008
$34
8.5x
$290
(152)
$138
1.5
12.5%
$116
50%
$58
(24)
$34
39.5
$0.85
$0.66
$1.05
Morocco
Fees
2008
$6
14.0x
$80
0
$80
1.5
12.5%
$67
100%
$67
0
$67
39.5
$1.70
$1.55
$1.84
Mohegan
BLB
Phase III
Morocco
Morocco Fees
The Palm
2009
The Palm
The Palm Fees
OC Condos
Condo Tel
Condo Tel Fees
Land ($ per acre)
$141
10.0x
$1,413
(1,124)
$289
2.5
12.5%
$215
50%
$108
(74)
$33
39.5
$0.84
$0.13
$1.58
Note: Development projects valuation multiples represents the midpoint of each project's assumed valuation range
1 Based on the midpoint of the valuation range
The Palm
Fees
2009
Low
High
$329
Development project valuation ranges
$24
14.0x
0
$329
2.5
12.5%
$245
100%
$245
0
$245
39.5
$6.19
$5.63
$6.79
Development projects total
Low
EBITDA multiple
7.5x
10.0x
8.0x
13.0x
9.5x
13.0x
50% of
OC Condos
9.5x
$2.0
$33
100%
$33
0
$33
39.5
$0.84
$0.84
$0.85
High
8.5x
11.0x
9.0x
15.0x
10.5x
15.0x
10.0x
$6.0
50% of
Condo Tel
$75
100%
$75
(41)
$34
39.5
$0.85
$0.83
$0.86
Low
Condotel
Fees
2008
Discount rate
11.5%
11.5%
11.5%
11.5%
11.5%
11.5%
11.5%
11.5%
11.5%
11.5%
$24
9.8x
$238
0
$238
1.5
12.5%
$199
100%
$199
0
$199
39.5
$5.03
$4.84
$5.23
$20.97
$27.61
High
13.5%
13.5%
13.5%
13.5%
13.5%
13.5%
13.5%
13.5%
13.5%
13.5%
PROJECT PLATO
23View entire presentation