XP Inc Results Presentation Deck
Non-GAAP Financial Information
Floating and Adjusted Gross Financial Assets
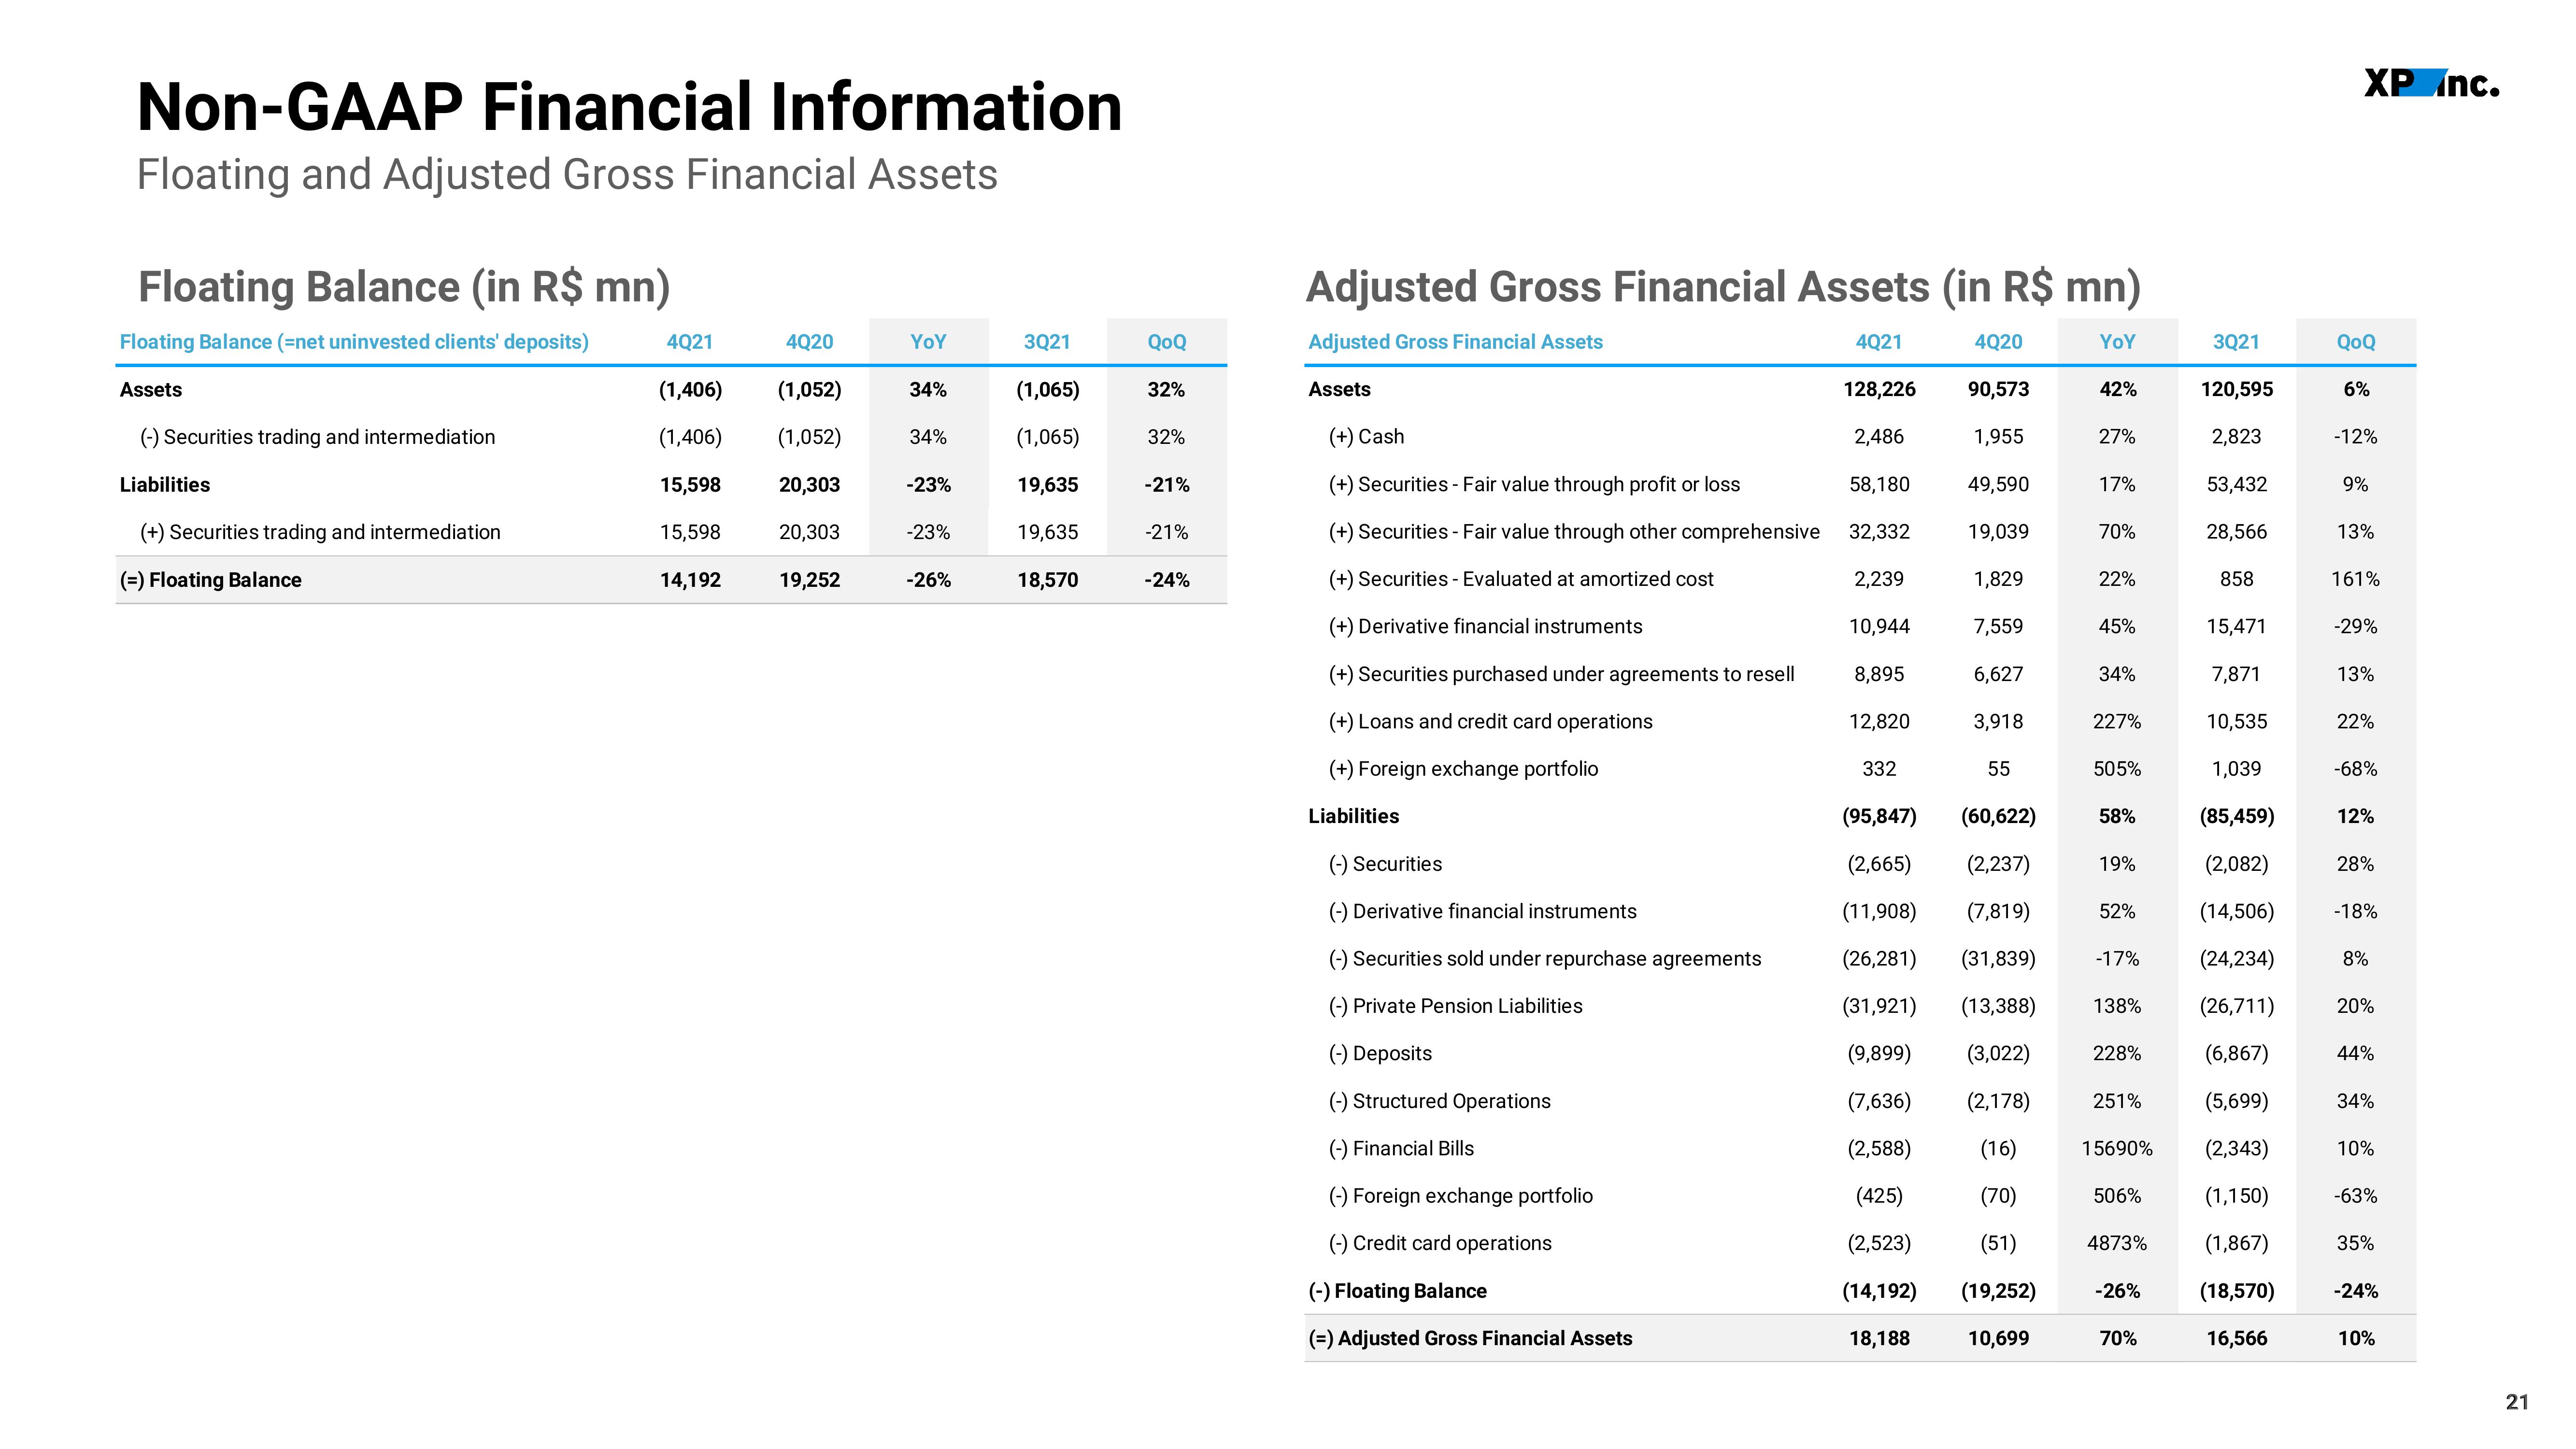
Floating Balance (in R$ mn)
Floating Balance (=net uninvested clients' deposits)
Assets
(-) Securities trading and intermediation
Liabilities
(+) Securities trading and intermediation
(=) Floating Balance
4021
(1,406)
(1,406)
15,598
15,598
14,192
4Q20
(1,052)
(1,052)
20,303
20,303
19,252
YoY
34%
34%
-23%
-23%
-26%
3Q21
(1,065)
(1,065)
19,635
19,635
18,570
QoQ
32%
32%
-21%
-21%
-24%
Adjusted Gross Financial Assets (in R$ mn)
Adjusted Gross Financial Assets
4Q21
YoY
Assets
(+) Cash
128,226
2,486
58,180
(+) Securities - Fair value through profit or loss
(+) Securities - Fair value through other comprehensive 32,332
(+) Securities - Evaluated at amortized cost
2,239
(+) Derivative financial instruments
10,944
(+) Securities purchased under agreements to resell
(+) Loans and credit card operations
(+) Foreign exchange portfolio
Liabilities
(-) Securities
(-) Derivative financial instruments
(-) Securities sold under repurchase agreements
(-) Private Pension Liabilities
(-) Deposits
(-) Structured Operations
(-) Financial Bills
(-) Foreign exchange portfolio
(-) Credit card operations
(-) Floating Balance
(=) Adjusted Gross Financial Assets
8,895
4Q20
12,820
90,573
1,955
49,590
19,039
1,829
7,559
6,627
3,918
42%
55
27%
17%
70%
22%
45%
15,471
7,871
10,535
(31,921)
332
1,039
(95,847) (60,622)
(85,459)
(2,665) (2,237)
(2,082)
(11,908) (7,819)
(14,506)
(26,281) (31,839)
(24,234)
(13,388)
(26,711)
(3,022)
(6,867)
(2,178) 251% (5,699)
15690%
(2,343)
506% (1,150)
(1,867)
(18,570)
16,566
(9,899)
(7,636)
(2,588)
(425)
(2,523)
(16)
(70)
(51)
(19,252)
10,699
(14,192)
18,188
34%
227%
505%
58%
19%
52%
-17%
138%
228%
4873%
-26%
3Q21
120,595
2,823
70%
53,432
28,566
858
XP Inc.
QoQ
6%
-12%
9%
13%
161%
-29%
13%
22%
-68%
12%
28%
-18%
8%
20%
44%
34%
10%
-63%
35%
-24%
10%
21View entire presentation