Experian ESG Presentation Deck
Executive Summary Improving Financial Health
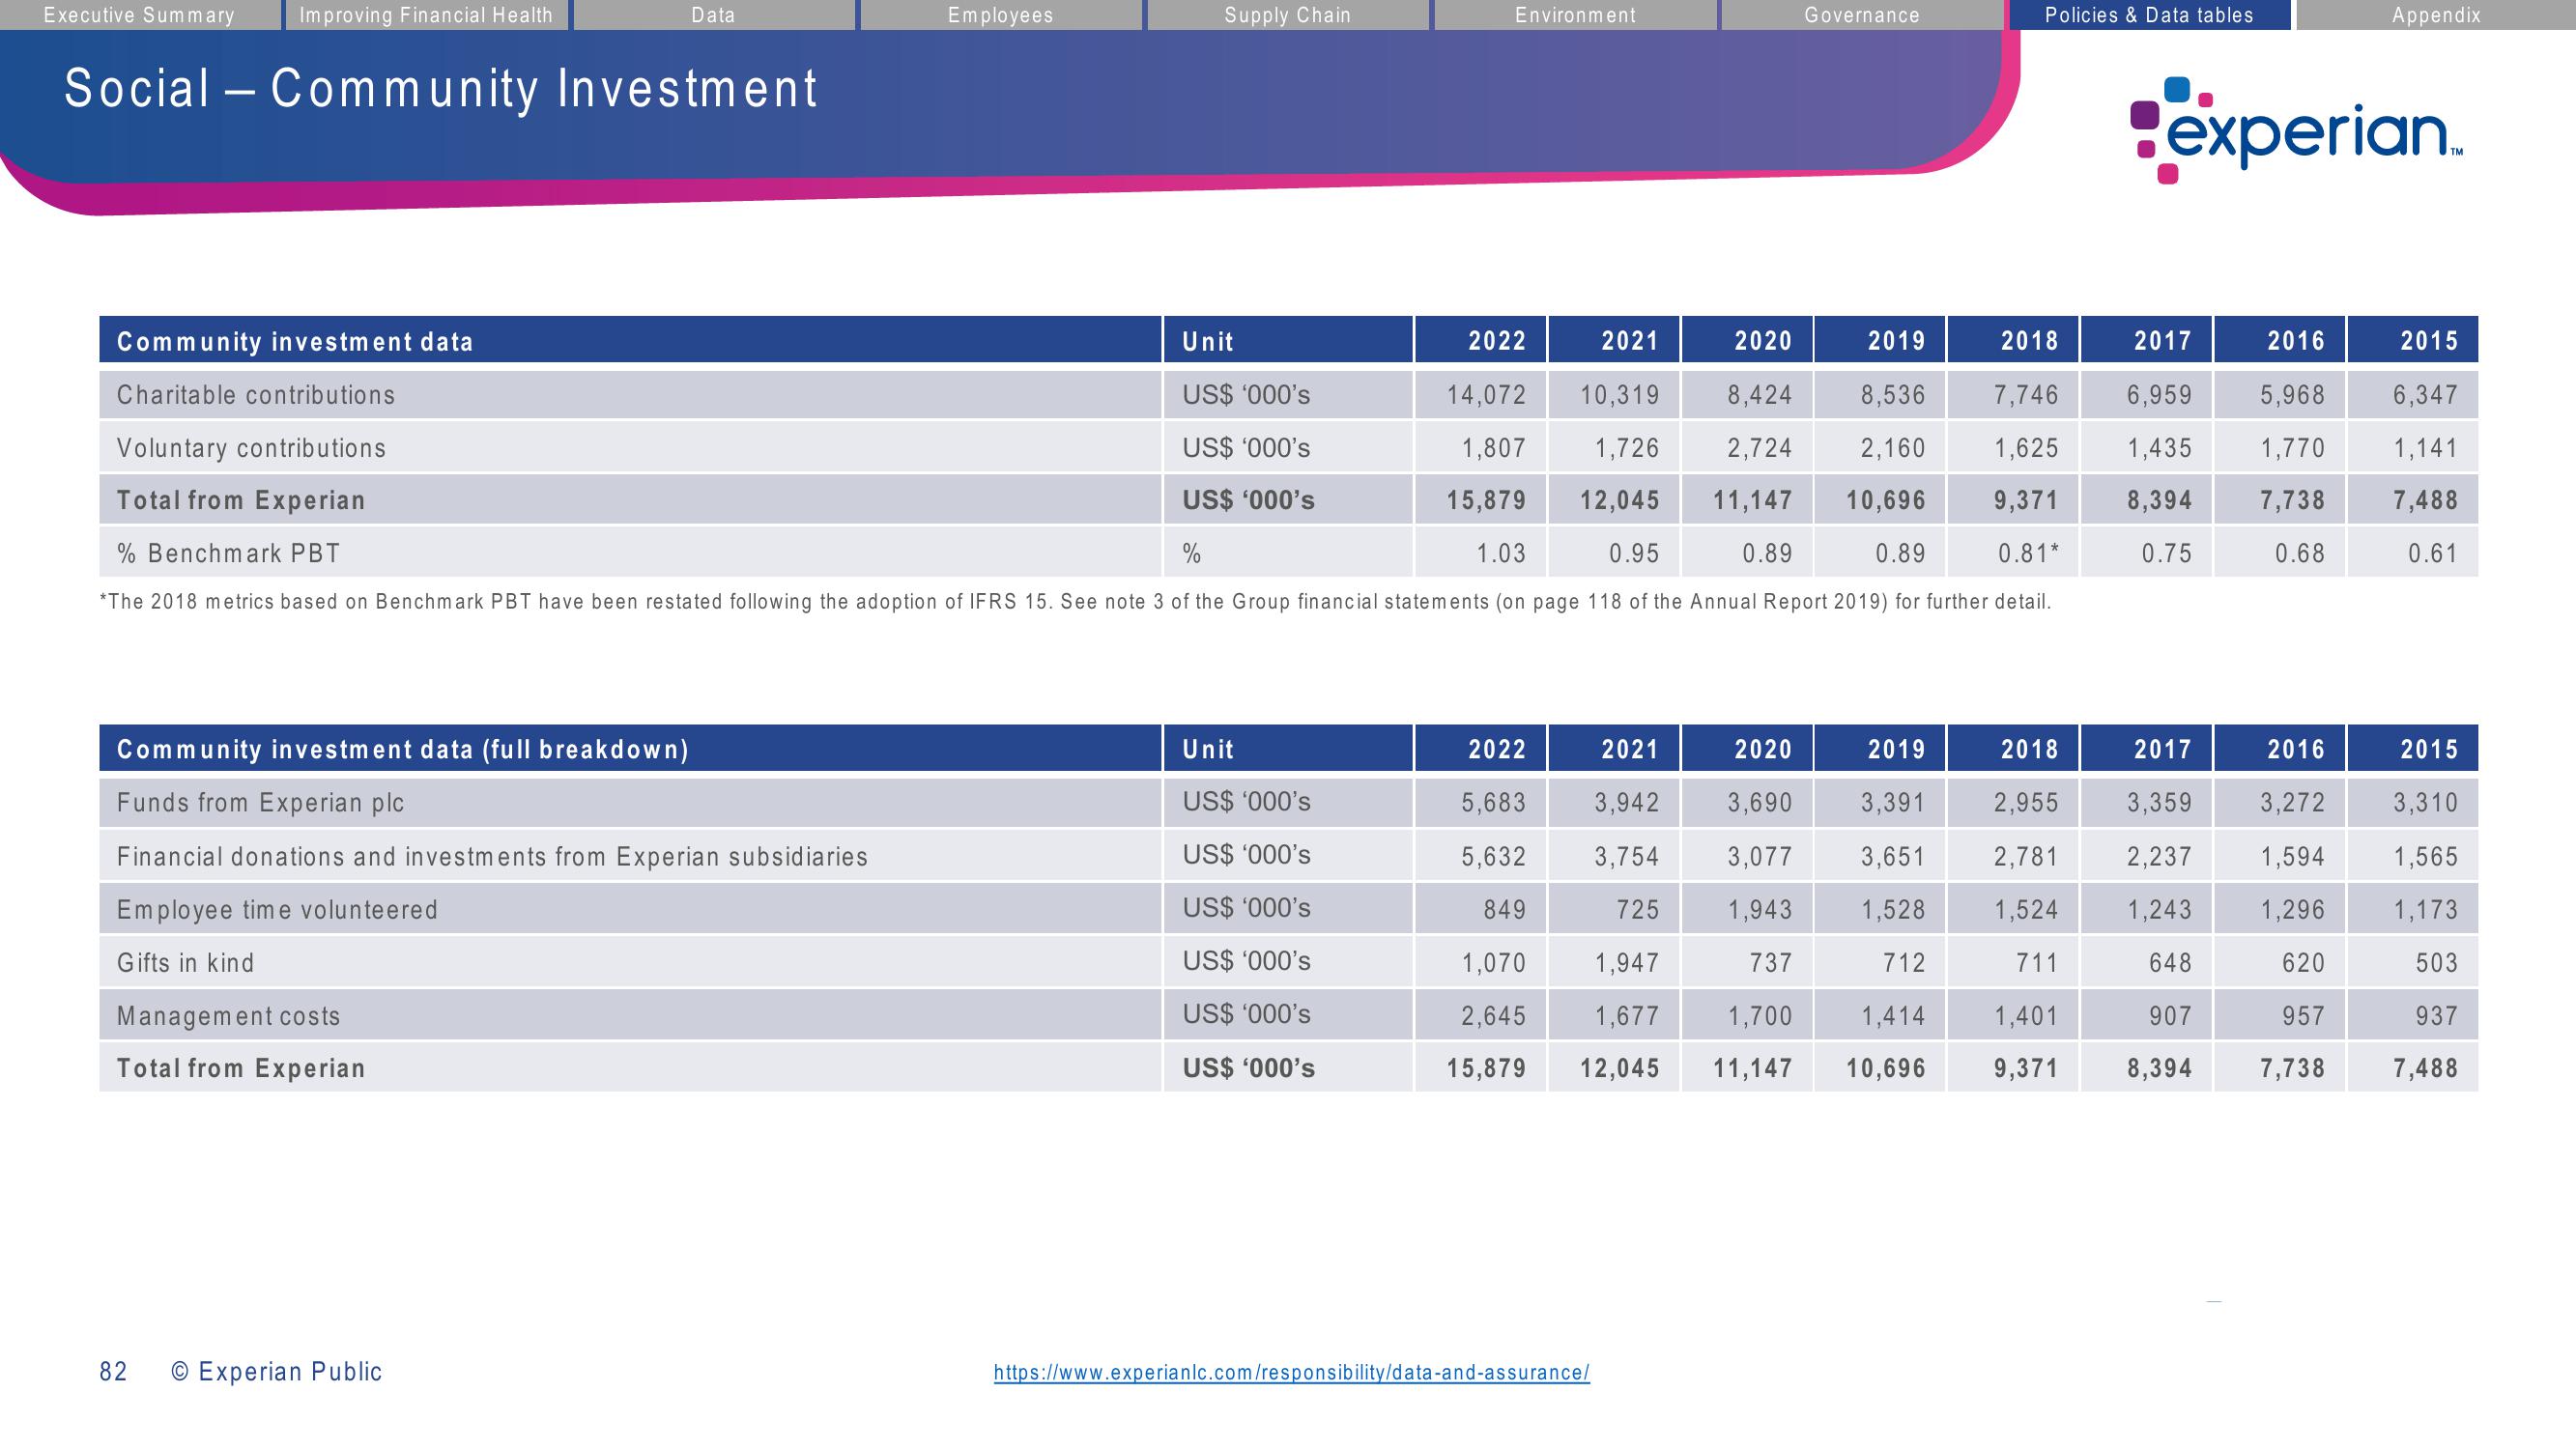
Social - Community Investment
Data
Community investment data (full breakdown)
Funds from Experian plc
Financial donations and investments from Experian subsidiaries
Employee time volunteered
Gifts in kind
Management costs
Total from Experian
82
O Experian Public
Employees
Supply Chain
Community investment data
Unit
2020
2019
2018
Charitable contributions
8,536
7,746
8,424
2,724
Voluntary contributions
2,160
1,625
US$ '000's
US$ '000's
US$ '000's
%
14,072 10,319
1,807 1,726
15,879 12,045
1.03
Total from Experian
11,147
10,696
9,371
% Benchmark PBT
0.95
0.89
0.89
0.81*
*The 2018 metrics based on Benchmark PBT have been restated following the adoption of IFRS 15. See note 3 of the Group financial statements (on page 118 of the Annual Report 2019) for further detail.
Environment
Unit
US$ '000's
US$ '000's
US$ '000's
US$ '000's
US$ '000's
US$ '000's
2022
Governance
2021
https://www.experianlc.com/responsibility/data-and-assurance/
2022
2021
2020
2019
5,683
3,942
3,690
3,391
5,632
3,754
3,077
3,651
1,528
849
725
1,943
1,070 1,947
737
2,645 1,677 1,700
15,879 12,045 11,147 10,696
712
1,414
Policies & Data tables
2018
2,955
2,781
1,524
711
1,401
9,371
experian
2017
6,959
1,435
8,394
0.75
2017
3,359
2,237
1,243
648
907
8,394
2016
5,968
1,770
7,738
0.68
Appendix
2016
3,272
1,594
1,296
620
957
7,738
TM
2015
6,347
1,141
7,488
0.61
2015
3,310
1,565
1,173
503
937
7,488View entire presentation