Netstreit Investor Presentation Deck
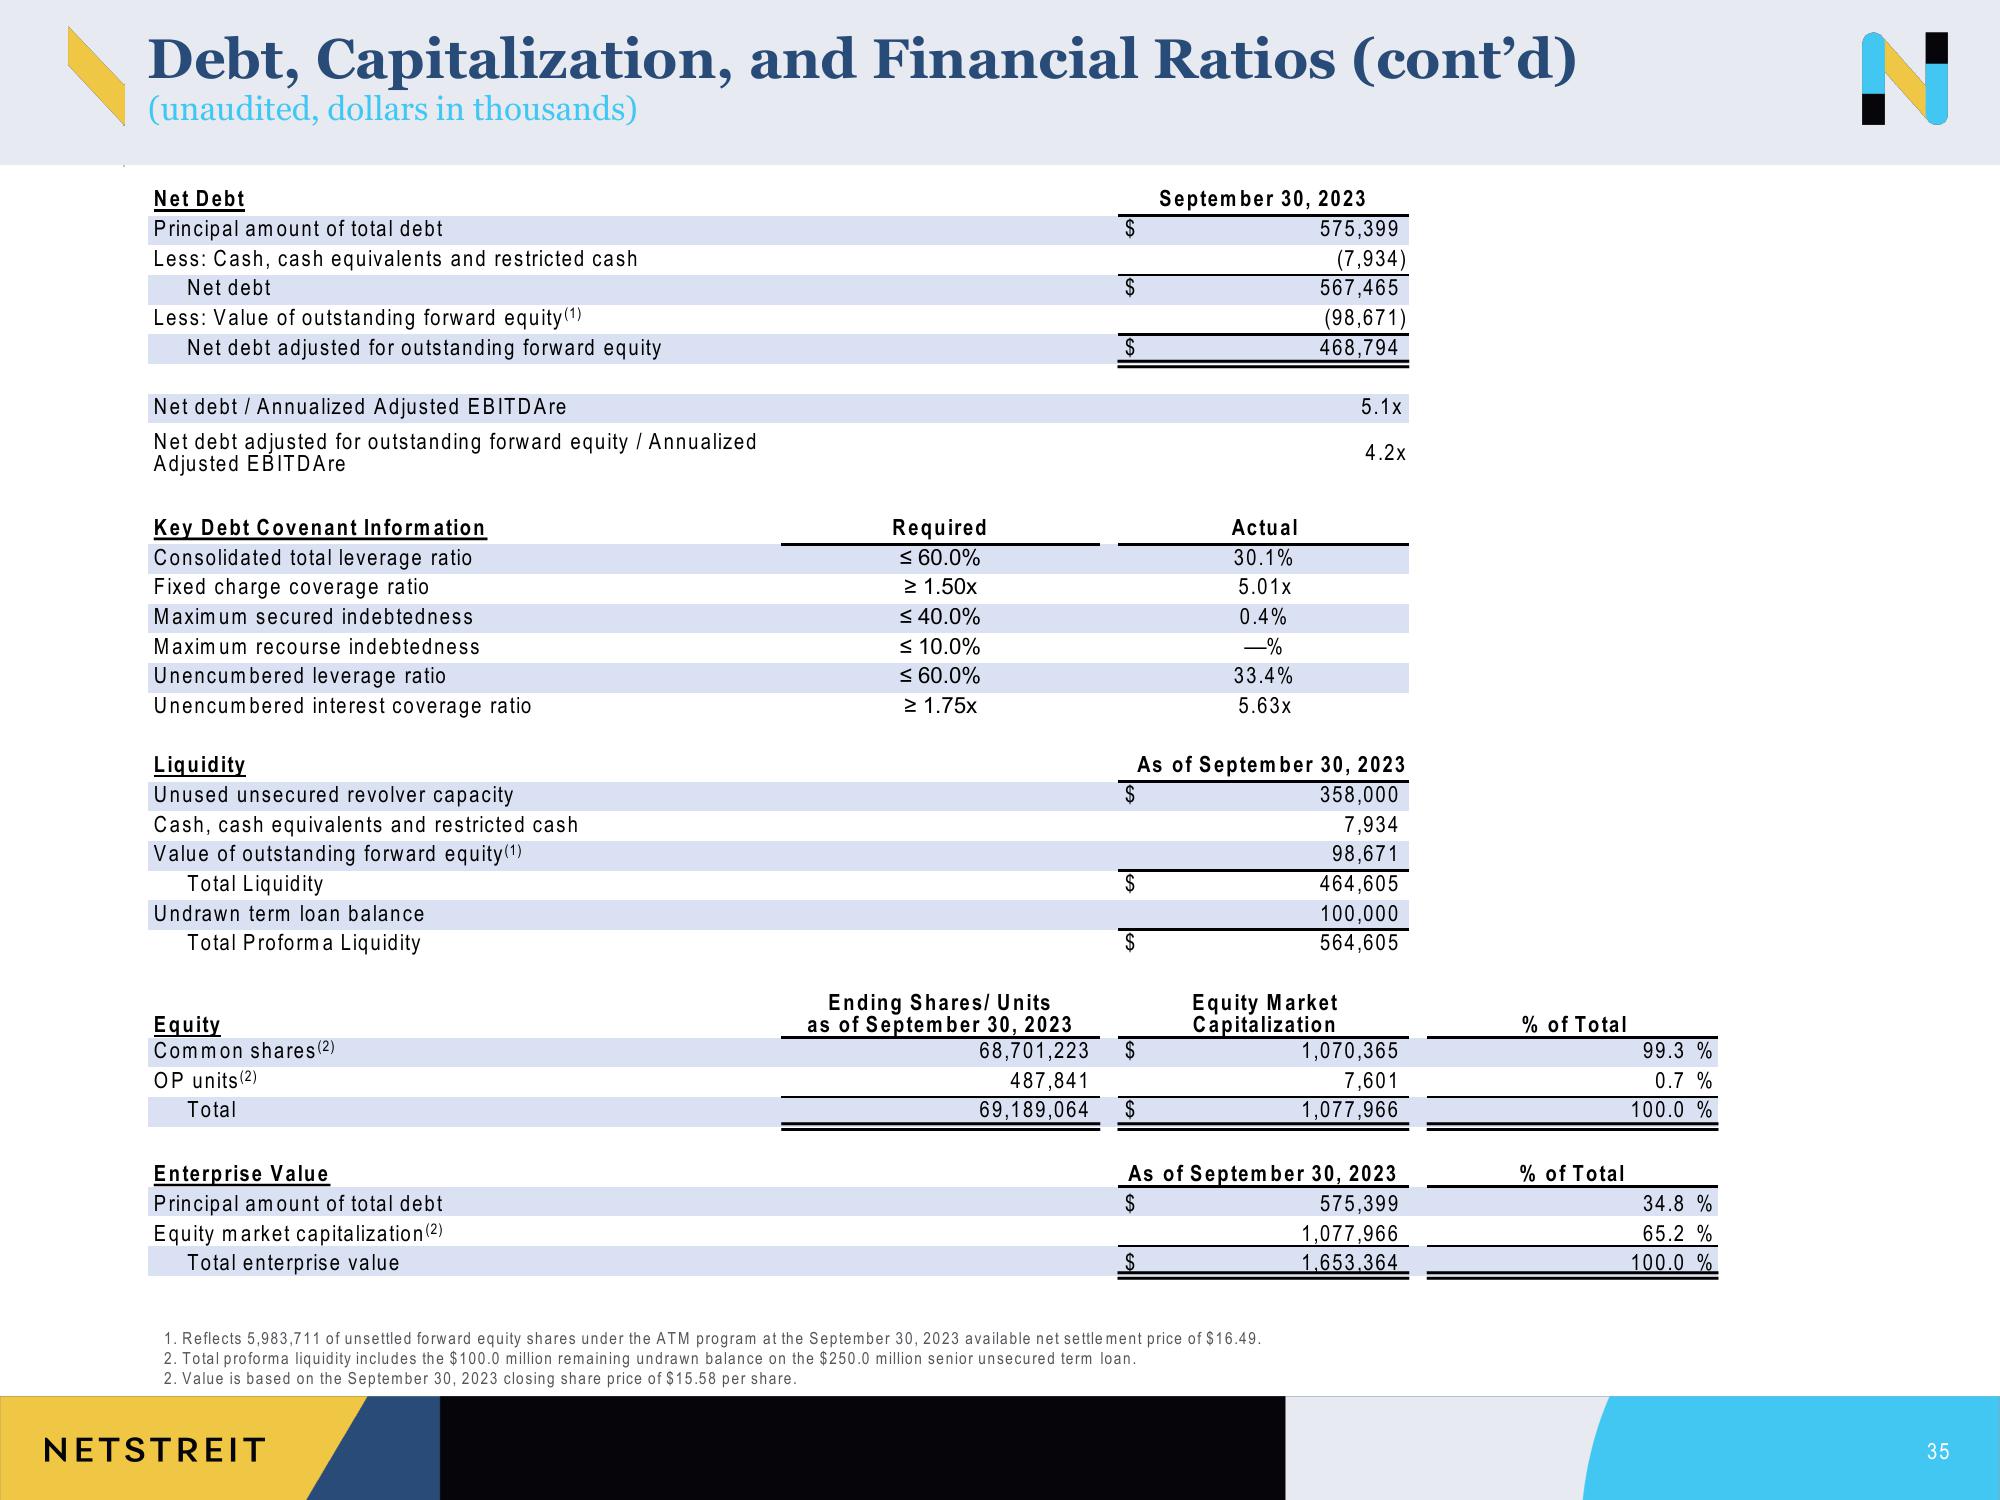
Debt, Capitalization, and Financial Ratios (cont'd)
(unaudited, dollars in thousands)
Net Debt
Principal amount of total debt
Less: Cash, cash equivalents and restricted cash
Net debt
Less: Value of outstanding forward equity (¹)
Net debt adjusted for outstanding forward equity
Net debt / Annualized Adjusted EBITDAre
Net debt adjusted for outstanding forward equity / Annualized
Adjusted EBITD Are
Key Debt Covenant Information
Consolidated total leverage ratio
Fixed charge coverage ratio
Maximum secured indebtedness
Maximum recourse indebtedness
Unencumbered leverage ratio
Unencumbered interest coverage ratio
Liquidity
Unused unsecured revolver capacity
Cash, cash equivalents and restricted cash
Value of outstanding forward equity (1)
Total Liquidity
Undrawn term loan balance
Total Proforma Liquidity
Equity
Common shares (2)
OP units (2)
Total
Enterprise Value
Principal amount of total debt
Equity market capitalization (2)
Total enterprise value
Required
≤ 60.0%
≥ 1.50x
≤ 40.0%
≤ 10.0%
≤ 60.0%
≥ 1.75x
NETSTREIT
Ending Shares/ Units
as of September 30, 2023
68,701,223
487,841
69,189,064
$
$
September 30, 2023
$
Actual
30.1%
5.01x
0.4%
—%
33.4%
5.63x
575,399
(7,934)
1. Reflects 5,983,711 of unsettled forward equity shares under the ATM program at the September 30, 2023 available net settlement price of $16.49.
2. Total proforma liquidity includes the $100.0 million remaining undrawn balance on the $250.0 million senior unsecured term loan.
2. Value is based on the September 30, 2023 closing share price of $15.58 per share.
567,465
(98,671)
468,794
As of September 30, 2023
358,000
7,934
98,671
464,605
100,000
564,605
Equity Market
Capitalization
5.1x
4.2x
1,070,365
7,601
1,077,966
$
As of September 30, 2023
575,399
1,077,966
1,653,364
% of Total
% of Total
99.3 %
0.7 %
100.0 %
34.8 %
65.2 %
100.0 %
35View entire presentation