Matterport SPAC Presentation Deck
Subscription
License
Services
Product
Total Revenue
Subscription GM%
Total GM %
Operating Expenses
% of Revenue
Operating Income
Operating Margin
EBITDA
% of Revenue
$
$
$
$
$
$
2019A
24.5 $
$
2.9 $
18.6 $
46.0 $
82.2%
48.4%
53.7 $
117%
(31.4) $
(68%)
(27.1) $
(59%)
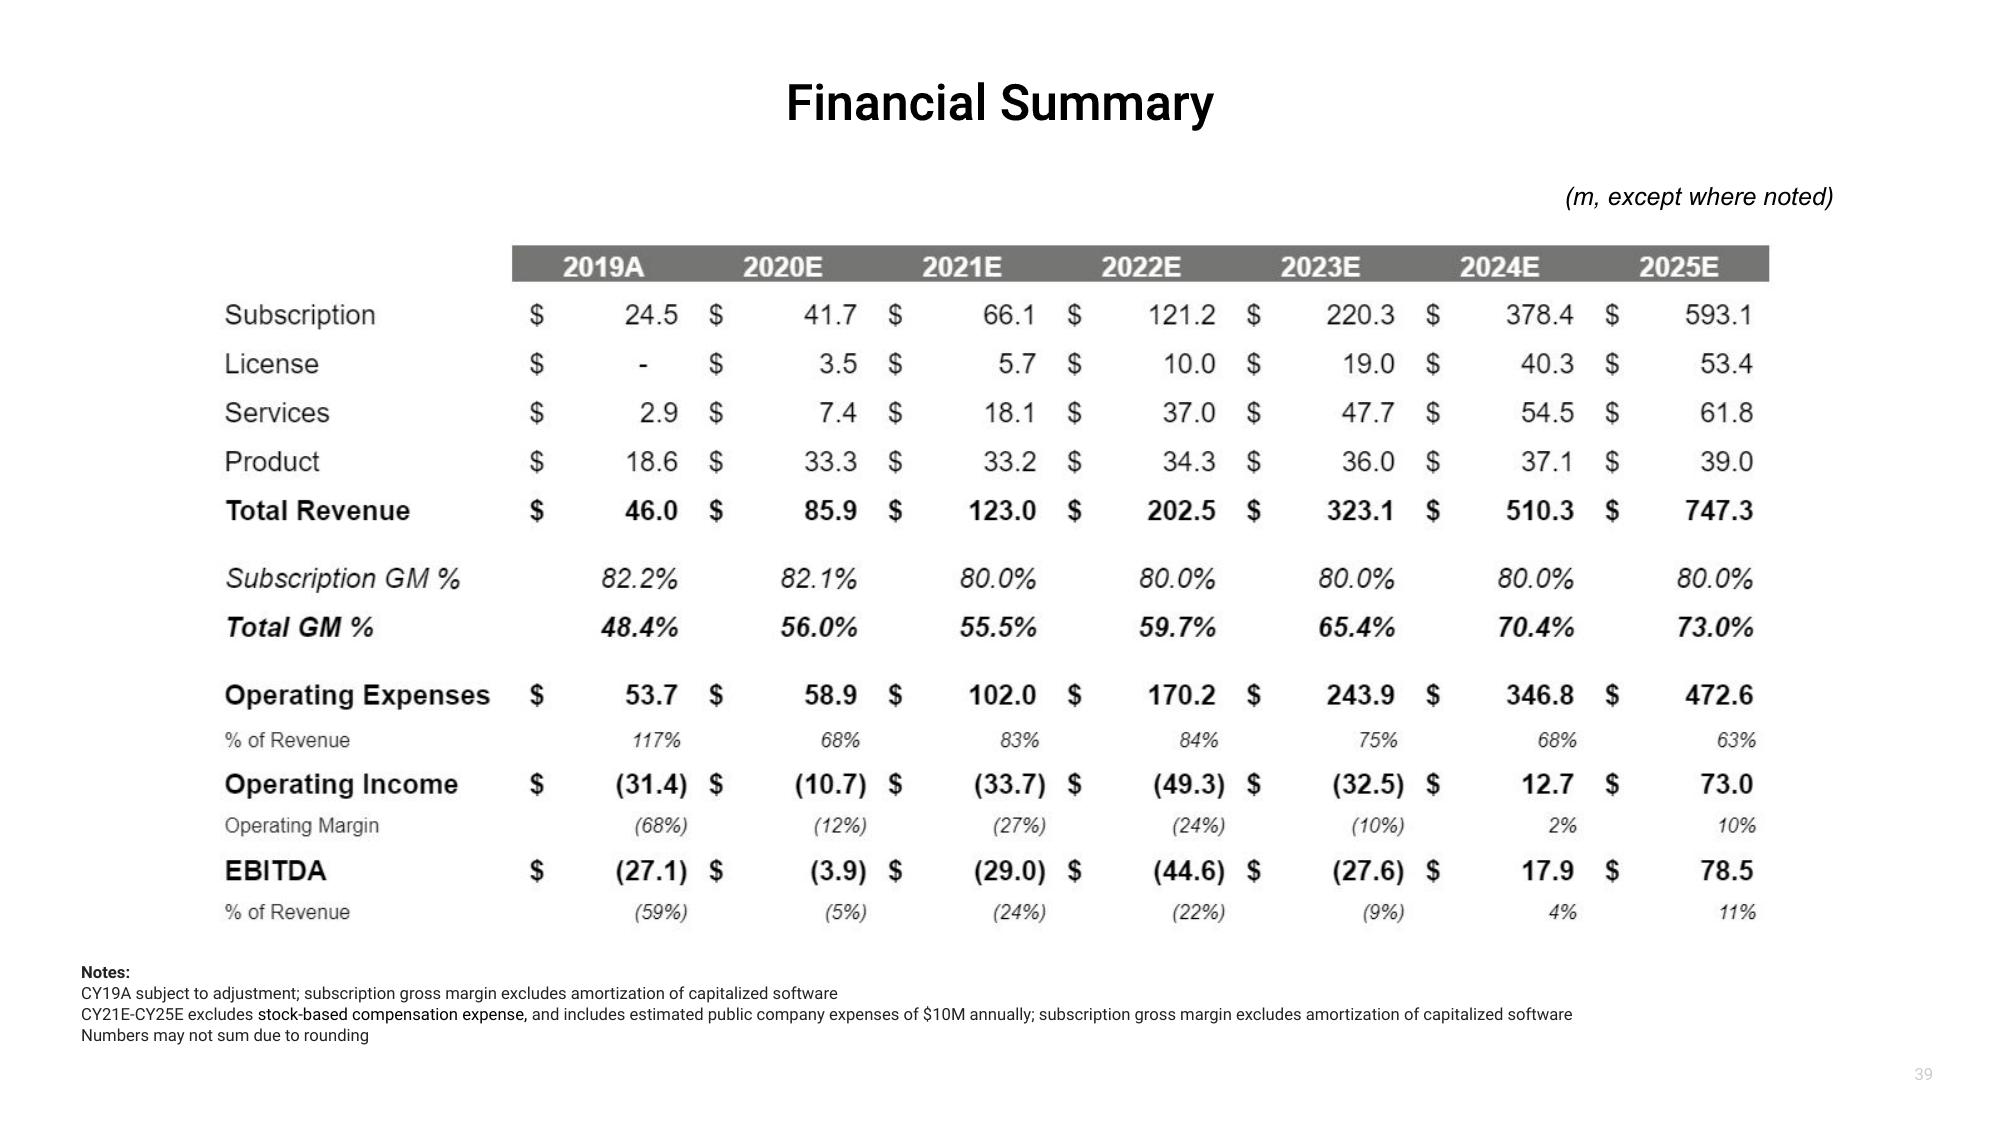
Financial Summary
2020E
41.7 $
3.5 $
7.4 $
33.3 $
85.9 $
82.1%
56.0%
58.9
68%
(10.7) $
(12%)
(3.9) $
(5%)
2021E
66.1 $
5.7 $
18.1 $
33.2 $
123.0 $
80.0%
55.5%
102.0 $
83%
(33.7) $
(27%)
(29.0) $
(24%)
2022E
121.2 $
10.0 $
37.0 $
34.3 $
202.5 $
80.0%
59.7%
170.2 $
84%
(49.3) $
(24%)
(44.6) $
(22%)
2023E
220.3 $
19.0 $
47.7 $
36.0 $
323.1 $
80.0%
65.4%
243.9 $
75%
(32.5) $
(10%)
(27.6) $
(9%)
2024E
(m, except where noted)
378.4 $
40.3 $
54.5 $
37.1 $
510.3 $
80.0%
70.4%
346.8 $
68%
12.7 $
2%
17.9
4%
Notes:
CY19A subject to adjustment; subscription gross margin excludes amortization of capitalized software
CY21E-CY25E excludes stock-based compensation expense, and includes estimated public company expenses of $10M annually; subscription gross margin excludes amortization of capitalized software
Numbers may not sum due to rounding
2025E
593.1
53.4
61.8
39.0
747.3
80.0%
73.0%
472.6
63%
73.0
10%
78.5
11%
39View entire presentation