PropertyGuru SPAC Presentation Deck
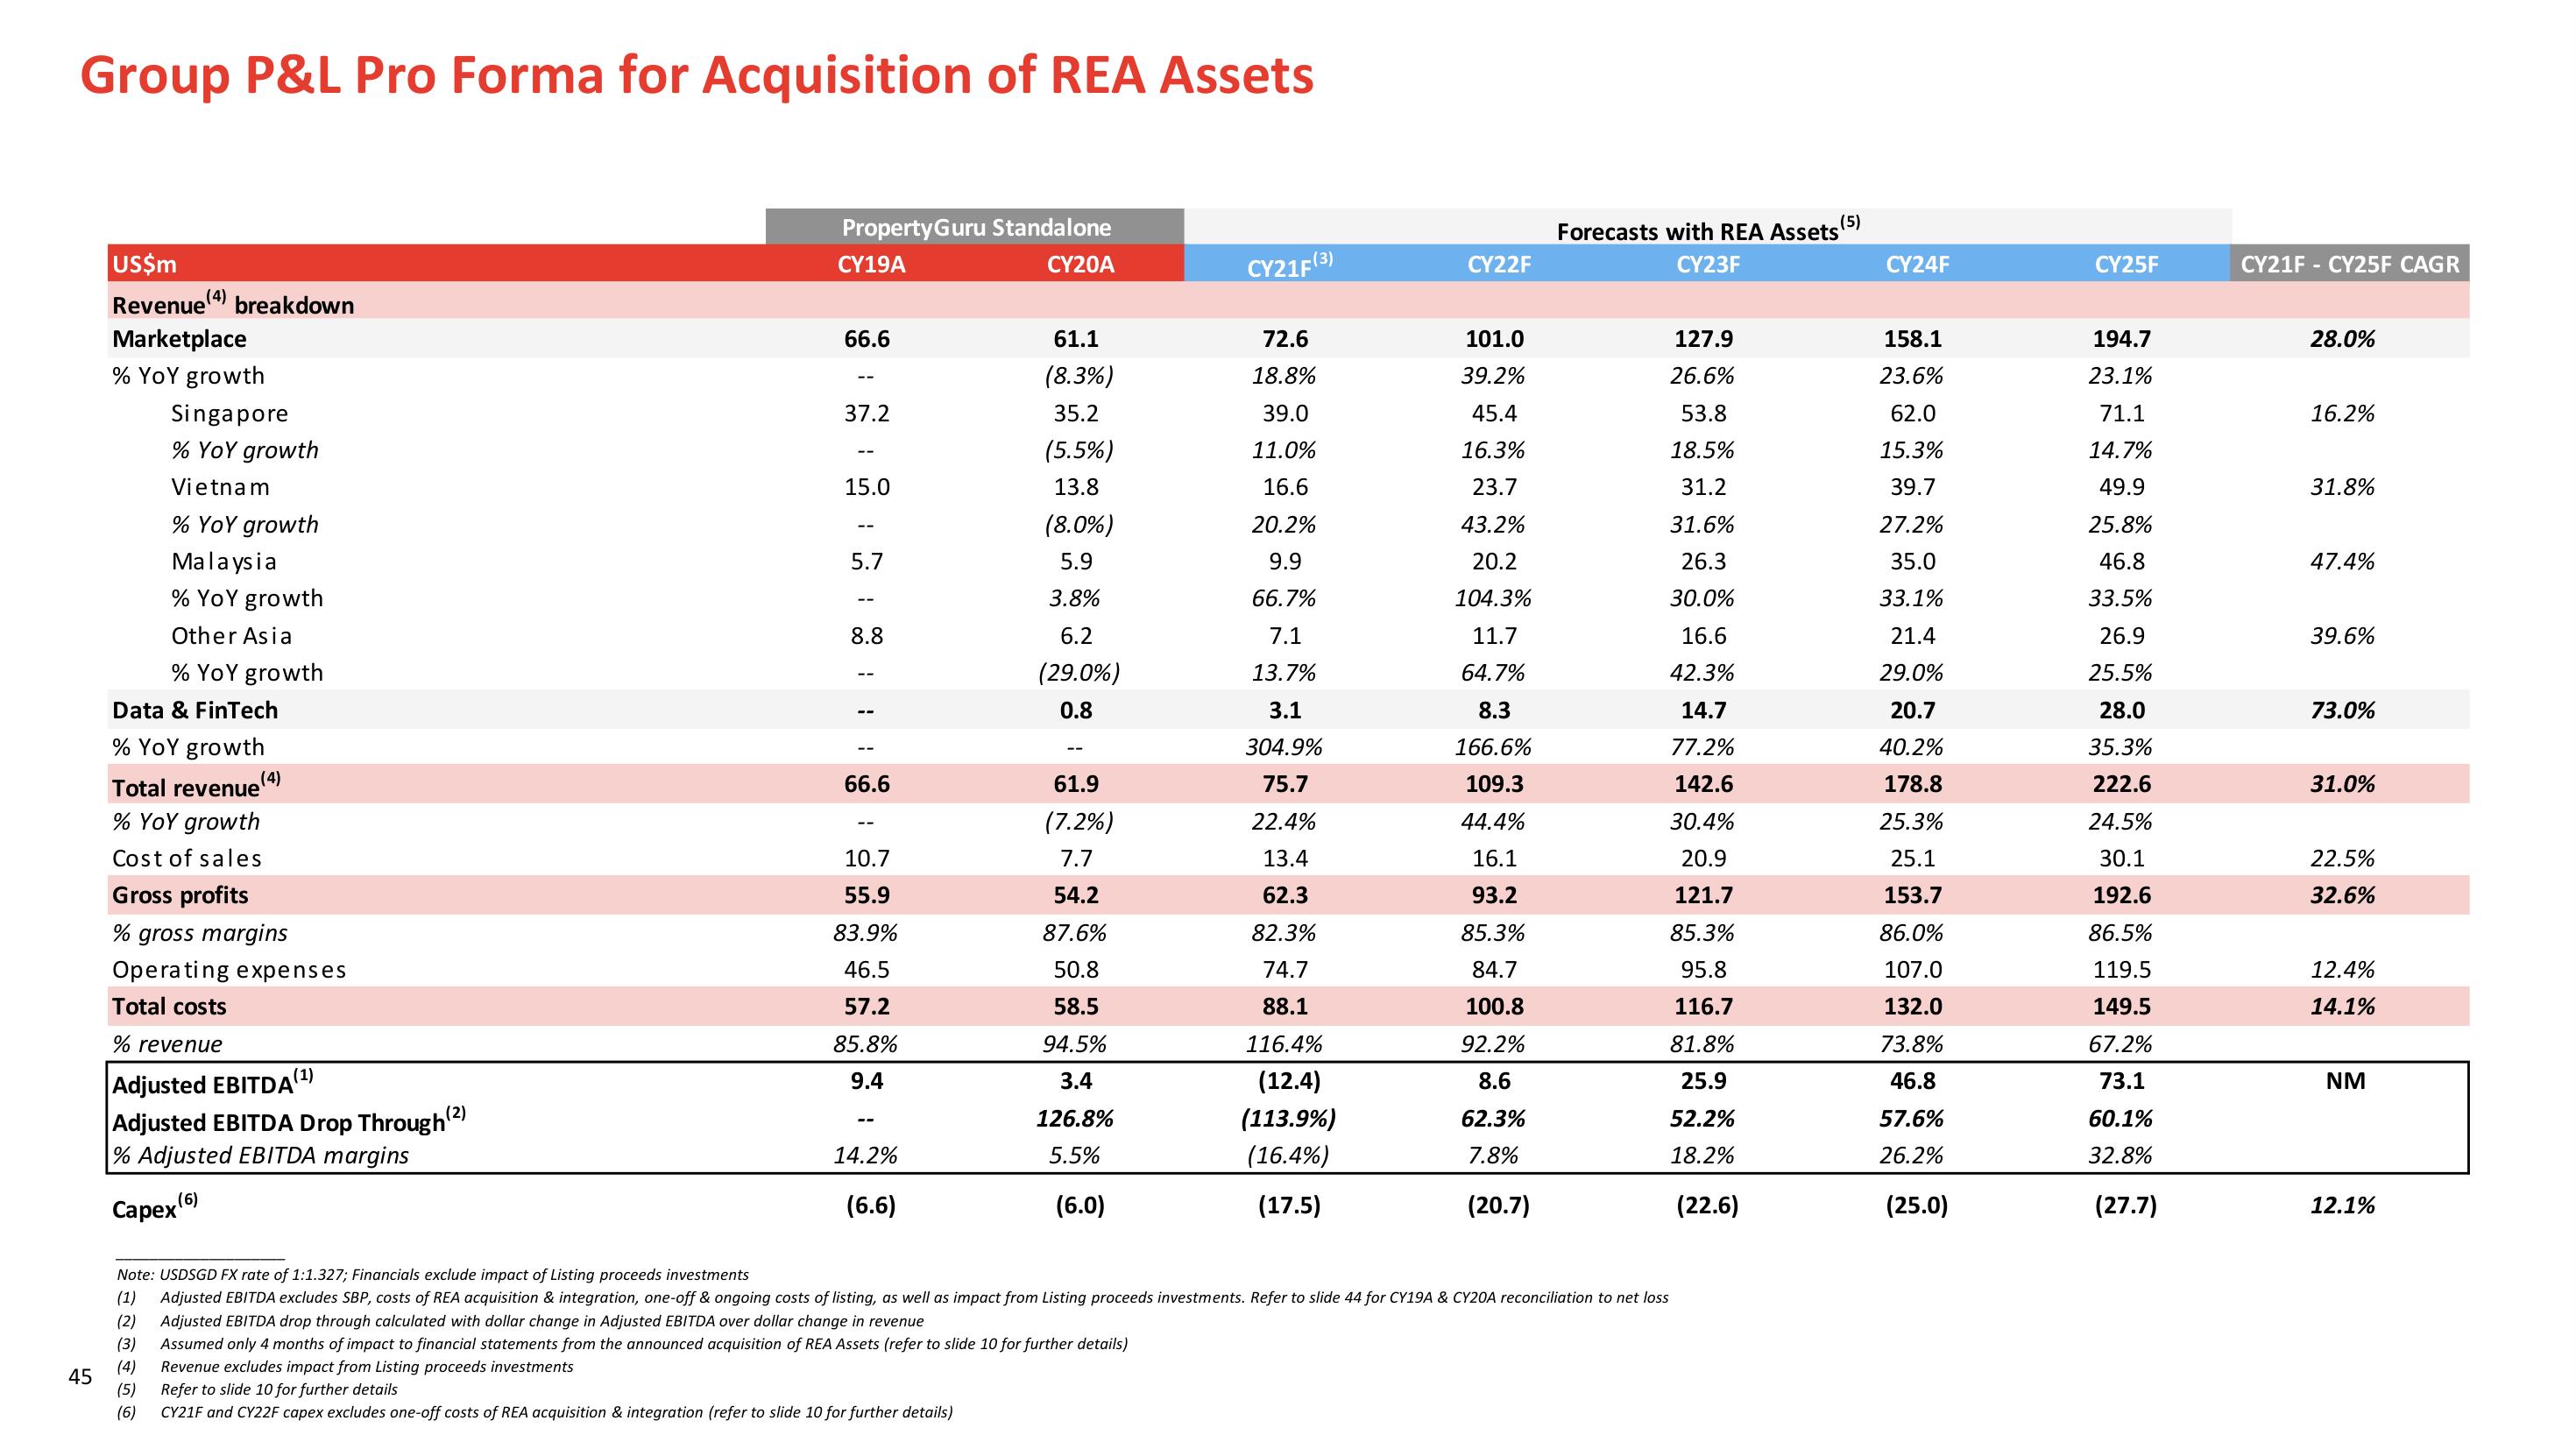
Group P&L Pro Forma for Acquisition of REA Assets
45
US$m
Revenue breakdown
Marketplace
% YoY growth
Singapore
% YoY growth
Vietnam
% YoY growth
Malaysia
% YoY growth
Other Asia
% YoY growth
Data & FinTech
% YoY growth
Total revenue (4)
% YoY growth
Cost of sales
Gross profits
% gross margins
Operating expenses
Total costs
% revenue
Adjusted EBITDA (¹)
Adjusted EBITDA Drop Through(²)
% Adjusted EBITDA margins
Capex (6)
PropertyGuru Standalone
CY20A
CY19A
66.6
37.2
15.0
5.7
8.8
--
66.6
--
10.7
55.9
83.9%
46.5
57.2
85.8%
9.4
--
14.2%
(6.6)
61.1
(8.3%)
35.2
(5.5%)
13.8
(8.0%)
5.9
3.8%
6.2
(29.0%)
0.8
Refer to slide 10 for further details
CY21F and CY22F capex excludes one-off costs of REA acquisition & integration (refer to slide 10 for further details)
--
61.9
(7.2%)
7.7
54.2
87.6%
50.8
58.5
94.5%
3.4
126.8%
5.5%
(6.0)
CY21F (3)
72.6
18.8%
39.0
11.0%
16.6
20.2%
9.9
66.7%
7.1
13.7%
3.1
304.9%
75.7
22.4%
13.4
62.3
82.3%
74.7
88.1
116.4%
(12.4)
(113.9%)
(16.4%)
(17.5)
CY22F
101.0
39.2%
45.4
16.3%
23.7
43.2%
20.2
104.3%
11.7
64.7%
8.3
166.6%
109.3
44.4%
16.1
93.2
85.3%
84.7
100.8
92.2%
8.6
62.3%
7.8%
(20.7)
Forecasts with REA Assets (5)
CY23F
127.9
26.6%
53.8
18.5%
31.2
31.6%
26.3
30.0%
16.6
42.3%
14.7
77.2%
142.6
30.4%
20.9
121.7
85.3%
95.8
116.7
81.8%
25.9
52.2%
18.2%
(22.6)
Note: USDSGD FX rate of 1:1.327; Financials exclude impact of Listing proceeds investments
(1) Adjusted EBITDA excludes SBP, costs of REA acquisition & integration, one-off & ongoing costs of listing, as well as impact from Listing proceeds investments. Refer to slide 44 for CY19A & CY20A reconciliation to net loss
(2) Adjusted EBITDA drop through calculated with dollar change in Adjusted EBITDA over dollar change in revenue
(3)
Assumed only 4 months of impact to financial statements from the announced acquisition of REA Assets (refer to slide 10 for further details)
Revenue excludes impact from Listing proceeds investments
(4)
(5)
(6)
CY24F
158.1
23.6%
62.0
15.3%
39.7
27.2%
35.0
33.1%
21.4
29.0%
20.7
40.2%
178.8
25.3%
25.1
153.7
86.0%
107.0
132.0
73.8%
46.8
57.6%
26.2%
(25.0)
CY25F
194.7
23.1%
71.1
14.7%
49.9
25.8%
46.8
33.5%
26.9
25.5%
28.0
35.3%
222.6
24.5%
30.1
192.6
86.5%
119.5
149.5
67.2%
73.1
60.1%
32.8%
(27.7)
CY21F CY25F CAGR
28.0%
16.2%
31.8%
47.4%
39.6%
73.0%
31.0%
22.5%
32.6%
12.4%
14.1%
NM
12.1%View entire presentation