FAT Brands Results Presentation Deck
Q1 2021 SALES IMPROVEMENTS¹ 2
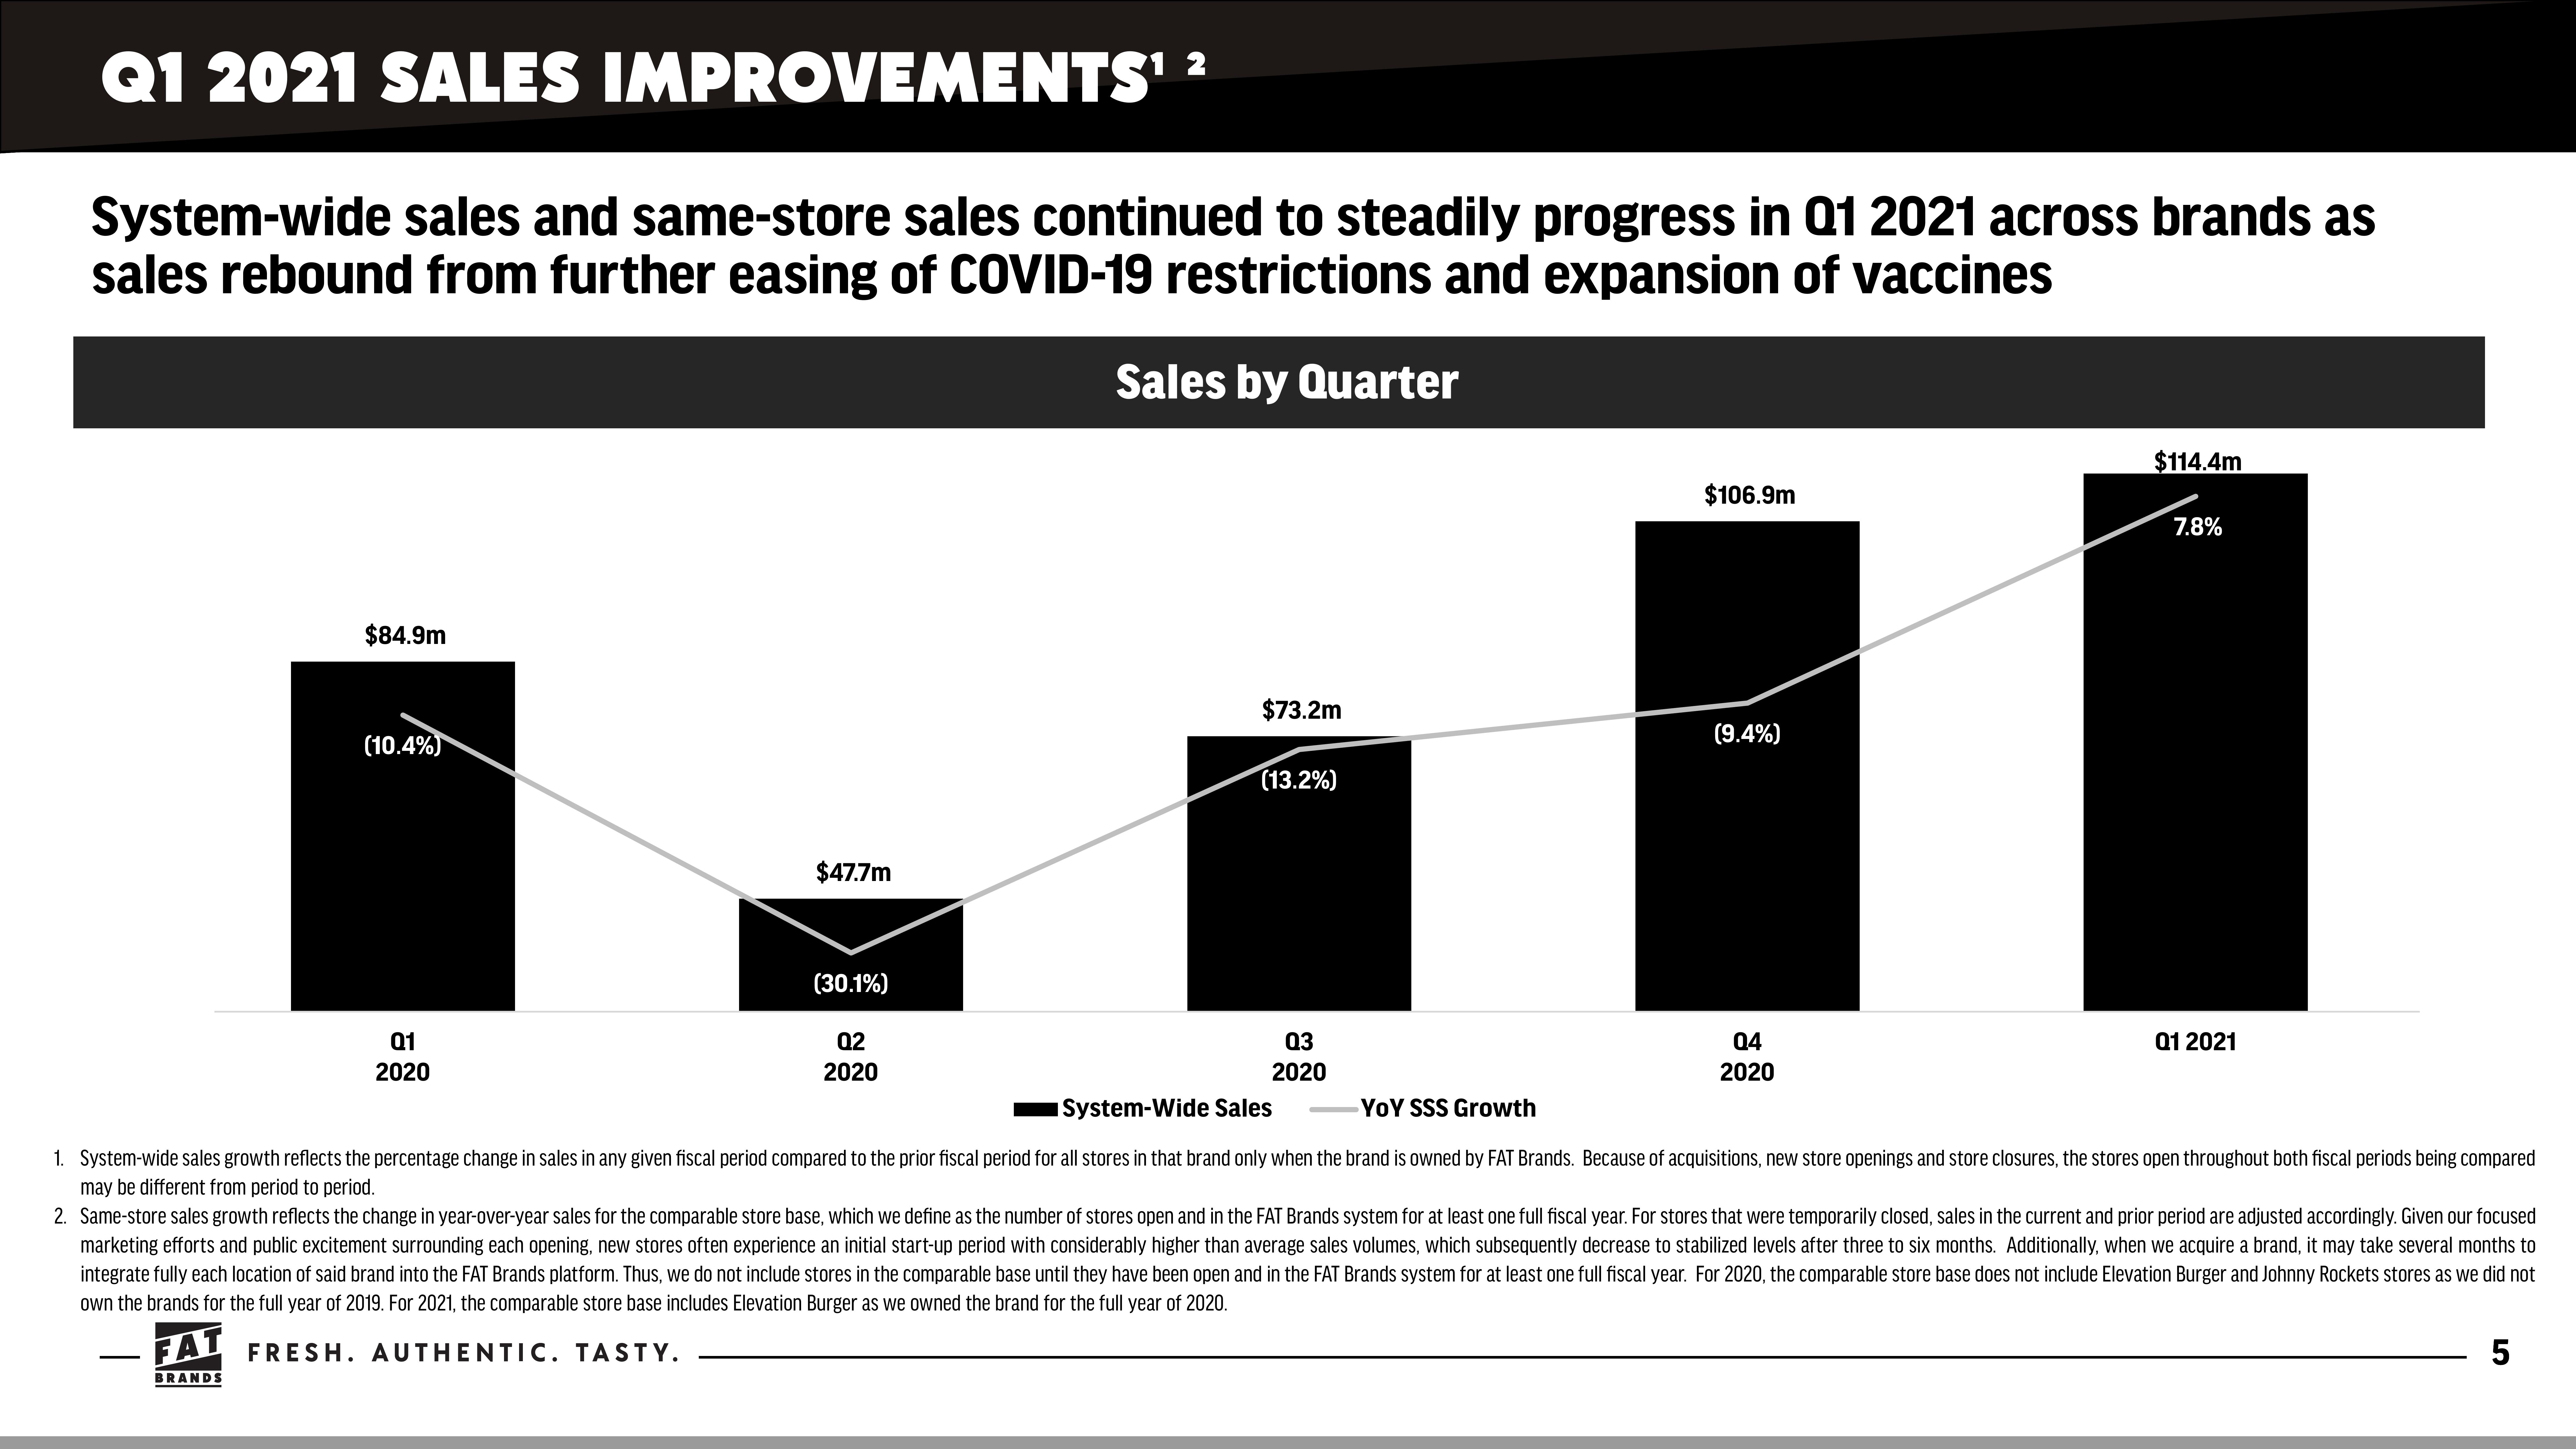
System-wide sales and same-store sales continued to steadily progress in Q1 2021 across brands as
sales rebound from further easing of COVID-19 restrictions and expansion of vaccines
Sales by Quarter
$84.9m
(10.4%)
01
2020
$47.7m
(30.1%)
02
2020
FAT FRESH. AUTHENTIC. TASTY.
BRANDS
$73.2m
(13.2%)
03
2020
$106.9m
(9.4%)
04
2020
$114.4m
7.8%
Q1 2021
System-Wide Sales
YOY SSS Growth
1. System-wide sales growth reflects the percentage change in sales in any given fiscal period compared to the prior fiscal period for all stores in that brand only when the brand is owned by FAT Brands. Because of acquisitions, new store openings and store closures, the stores open throughout both fiscal periods being compared
may be different from period to period.
2. Same-store sales growth reflects the change in year-over-year sales for the comparable store base, which we define as the number of stores open and in the FAT Brands system for at least one full fiscal year. For stores that were temporarily closed, sales in the current and prior period are adjusted accordingly. Given our focused
marketing efforts and public excitement surrounding each opening, new stores often experience an initial start-up period with considerably higher than average sales volumes, which subsequently decrease to stabilized levels after three to six months. Additionally, when we acquire a brand, it may take several months to
integrate fully each location of said brand into the FAT Brands platform. Thus, we do not include stores in the comparable base until they have been open and in the FAT Brands system for at least one full fiscal year. For 2020, the comparable store base does not include Elevation Burger and Johnny Rockets stores as we did not
own the brands for the full year of 2019. For 2021, the comparable store base includes Elevation Burger as we owned the brand for the full year of 2020.
5View entire presentation