XP Inc Results Presentation Deck
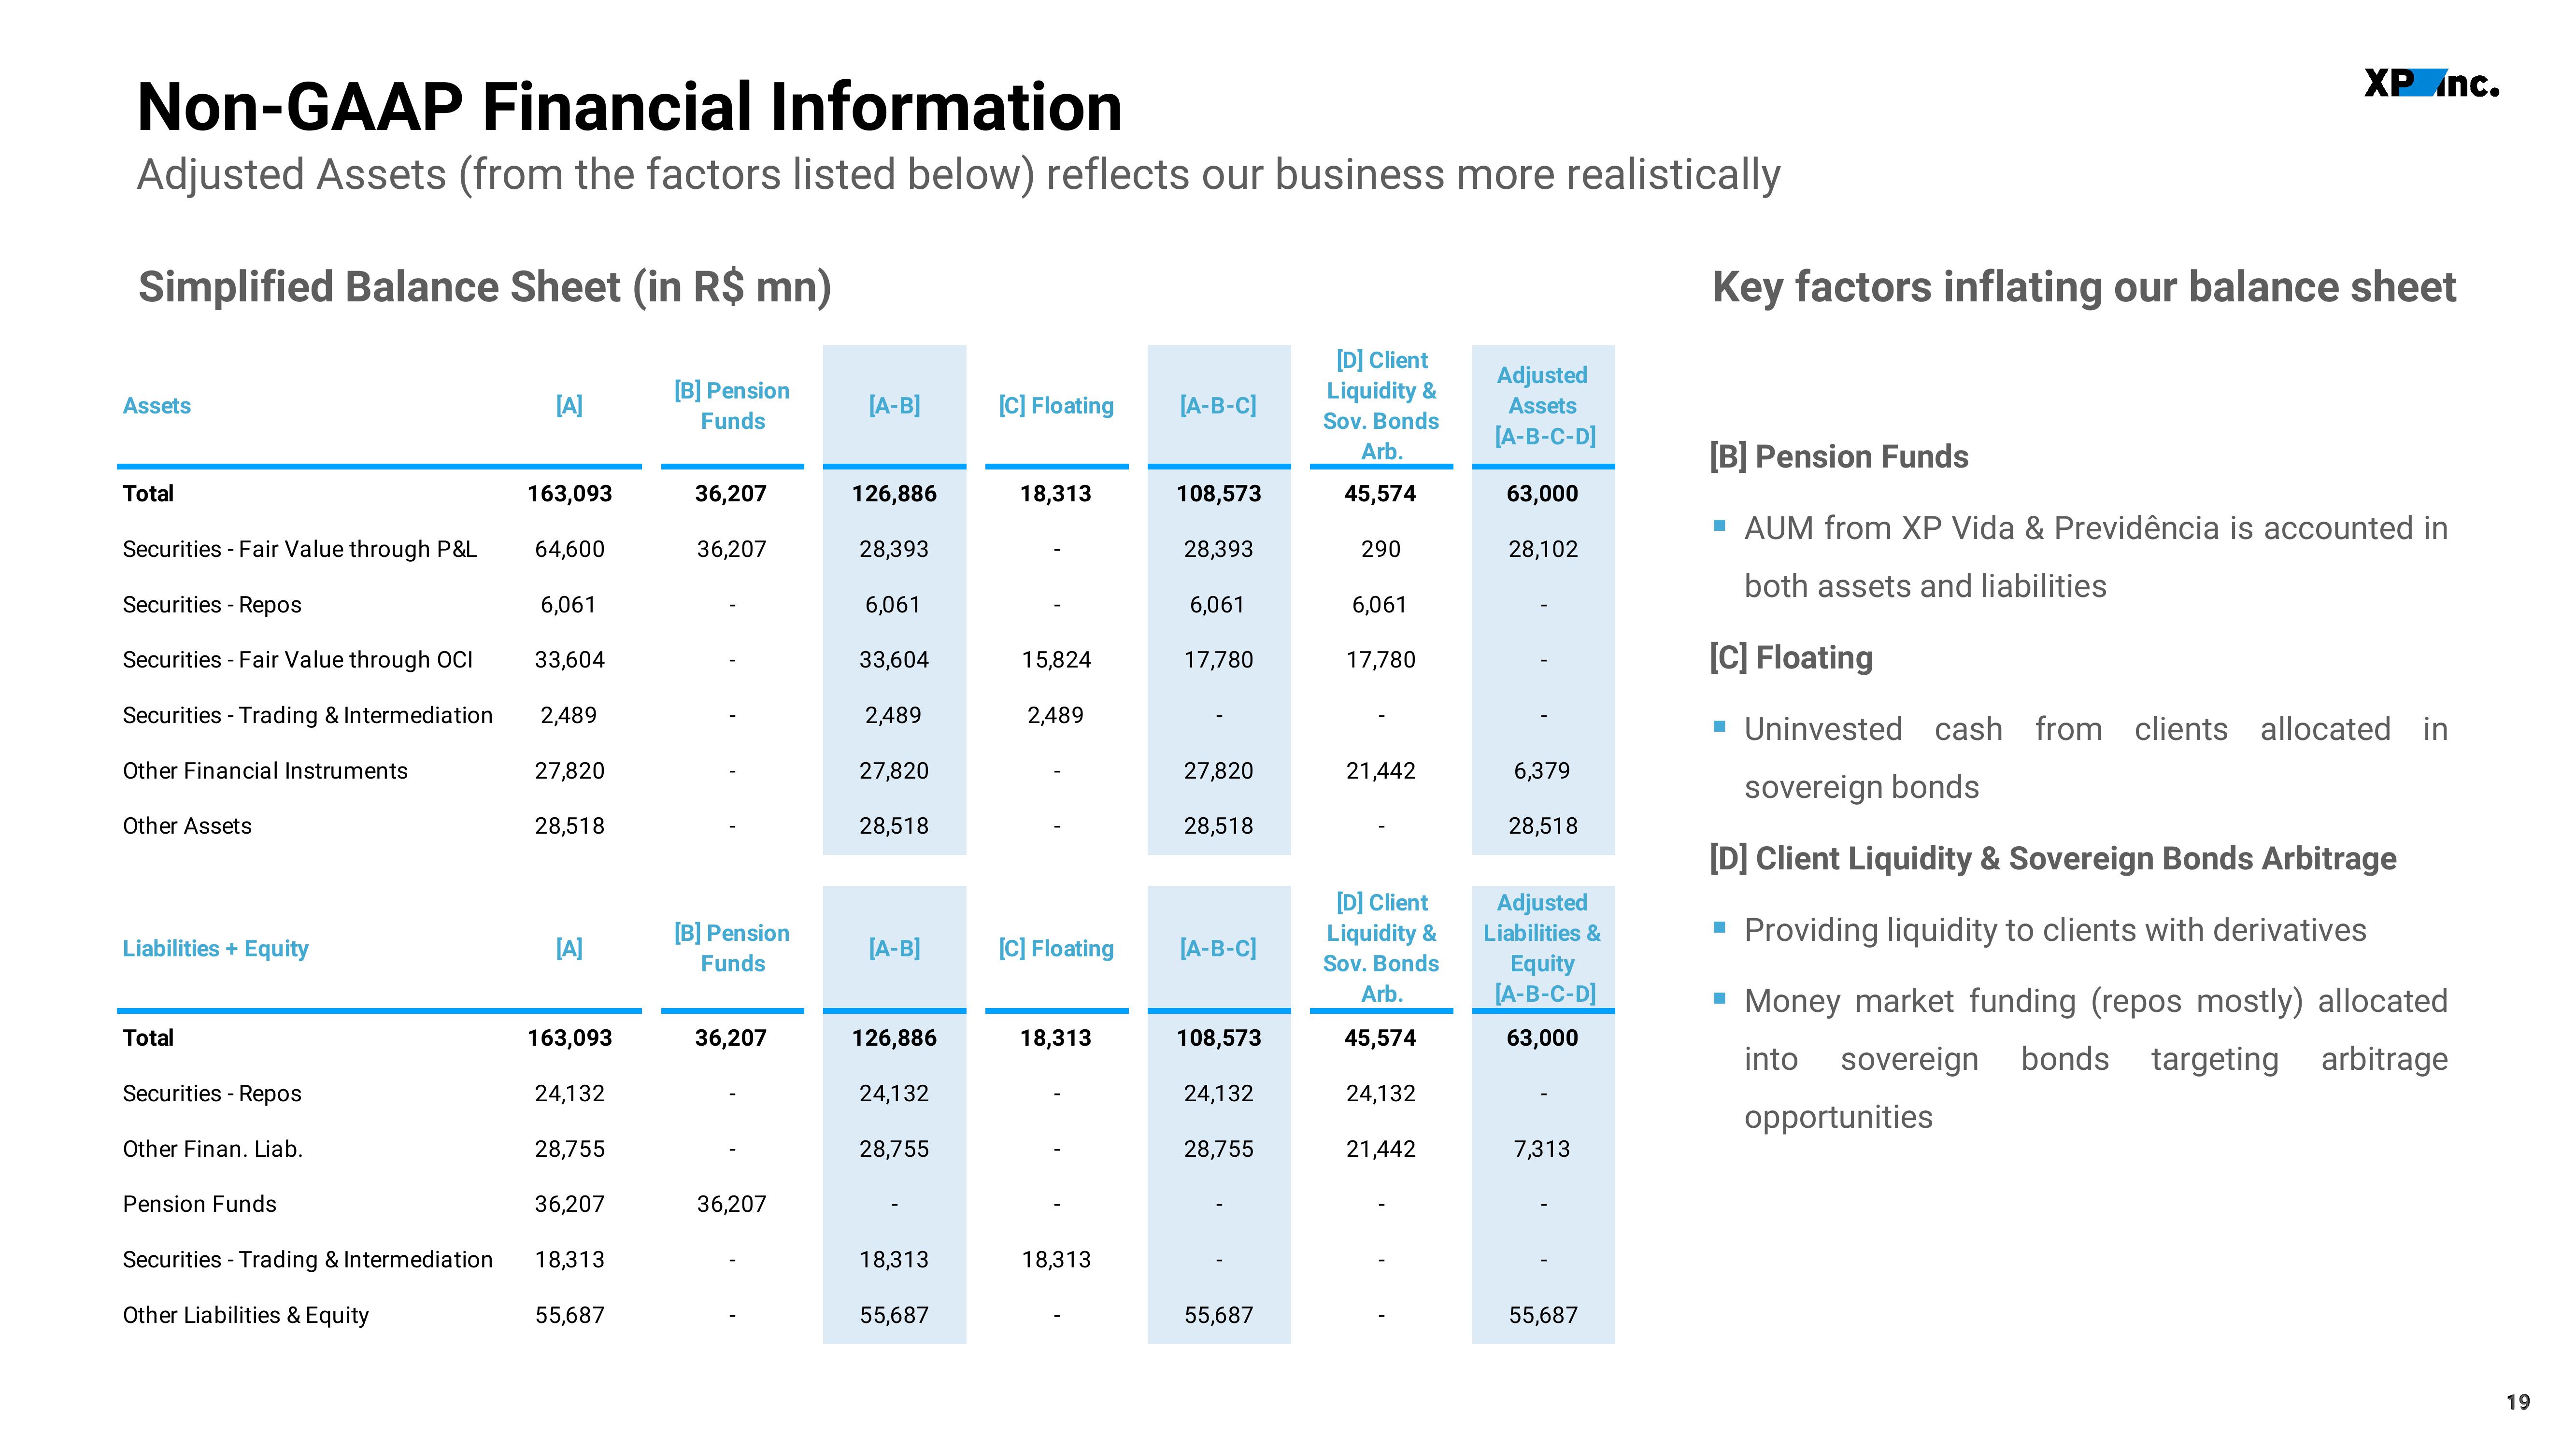
Non-GAAP Financial Information
Adjusted Assets (from the factors listed below) reflects our business more realistically
Simplified Balance Sheet (in R$ mn)
[B] Pension
Funds
Assets
Total
Securities - Fair Value through P&L
Securities - Repos
Securities - Fair Value through OCI
Securities - Trading & Intermediation
Other Financial Instruments
Other Assets
Liabilities + Equity
Total
Securities - Repos
Other Finan. Liab.
Pension Funds
Securities - Trading & Intermediation
Other Liabilities & Equity
[A]
163,093
64,600
6,061
33,604
2,489
27,820
28,518
[A]
163,093
24,132
28,755
36,207
18,313
55,687
36,207
36,207
[B] Pension
Funds
36,207
36,207
[A-B]
126,886
28,393
6,061
33,604
2,489
27,820
28,518
[A-B]
126,886
24,132
28,755
18,313
55,687
[C] Floating
18,313
15,824
2,489
[C] Floating
18,313
18,313
[A-B-C]
108,573
28,393
6,061
17,780
27,820
28,518
[A-B-C]
108,573
24,132
28,755
55,687
[D] Client
Liquidity &
Sov. Bonds
Arb.
45,574
290
6,061
17,780
21,442
[D] Client
Liquidity &
Sov. Bonds
Arb.
45,574
24,132
21,442
Adjusted
Assets
[A-B-C-D]
63,000
28,102
6,379
28,518
Adjusted
Liabilities &
Equity
[A-B-C-D]
63,000
7,313
55,687
Key factors inflating our balance sheet
XP Inc.
[B] Pension Funds
▪ AUM from XP Vida & Previdência is accounted in
both assets and liabilities
[C] Floating
▪ Uninvested cash from clients allocated in
sovereign bonds
[D] Client Liquidity & Sovereign Bonds Arbitrage
Providing liquidity to clients with derivatives
▪ Money market funding (repos mostly) allocated
into sovereign bonds targeting arbitrage
■
opportunities
60
19View entire presentation