First Foundation Investor Presentation Deck
Profile of Deposits
$12,000
$10,000
$8,000
$6,000
$4,000
$2,000
$0
$4,891
$1,208
$1,251
$2,285
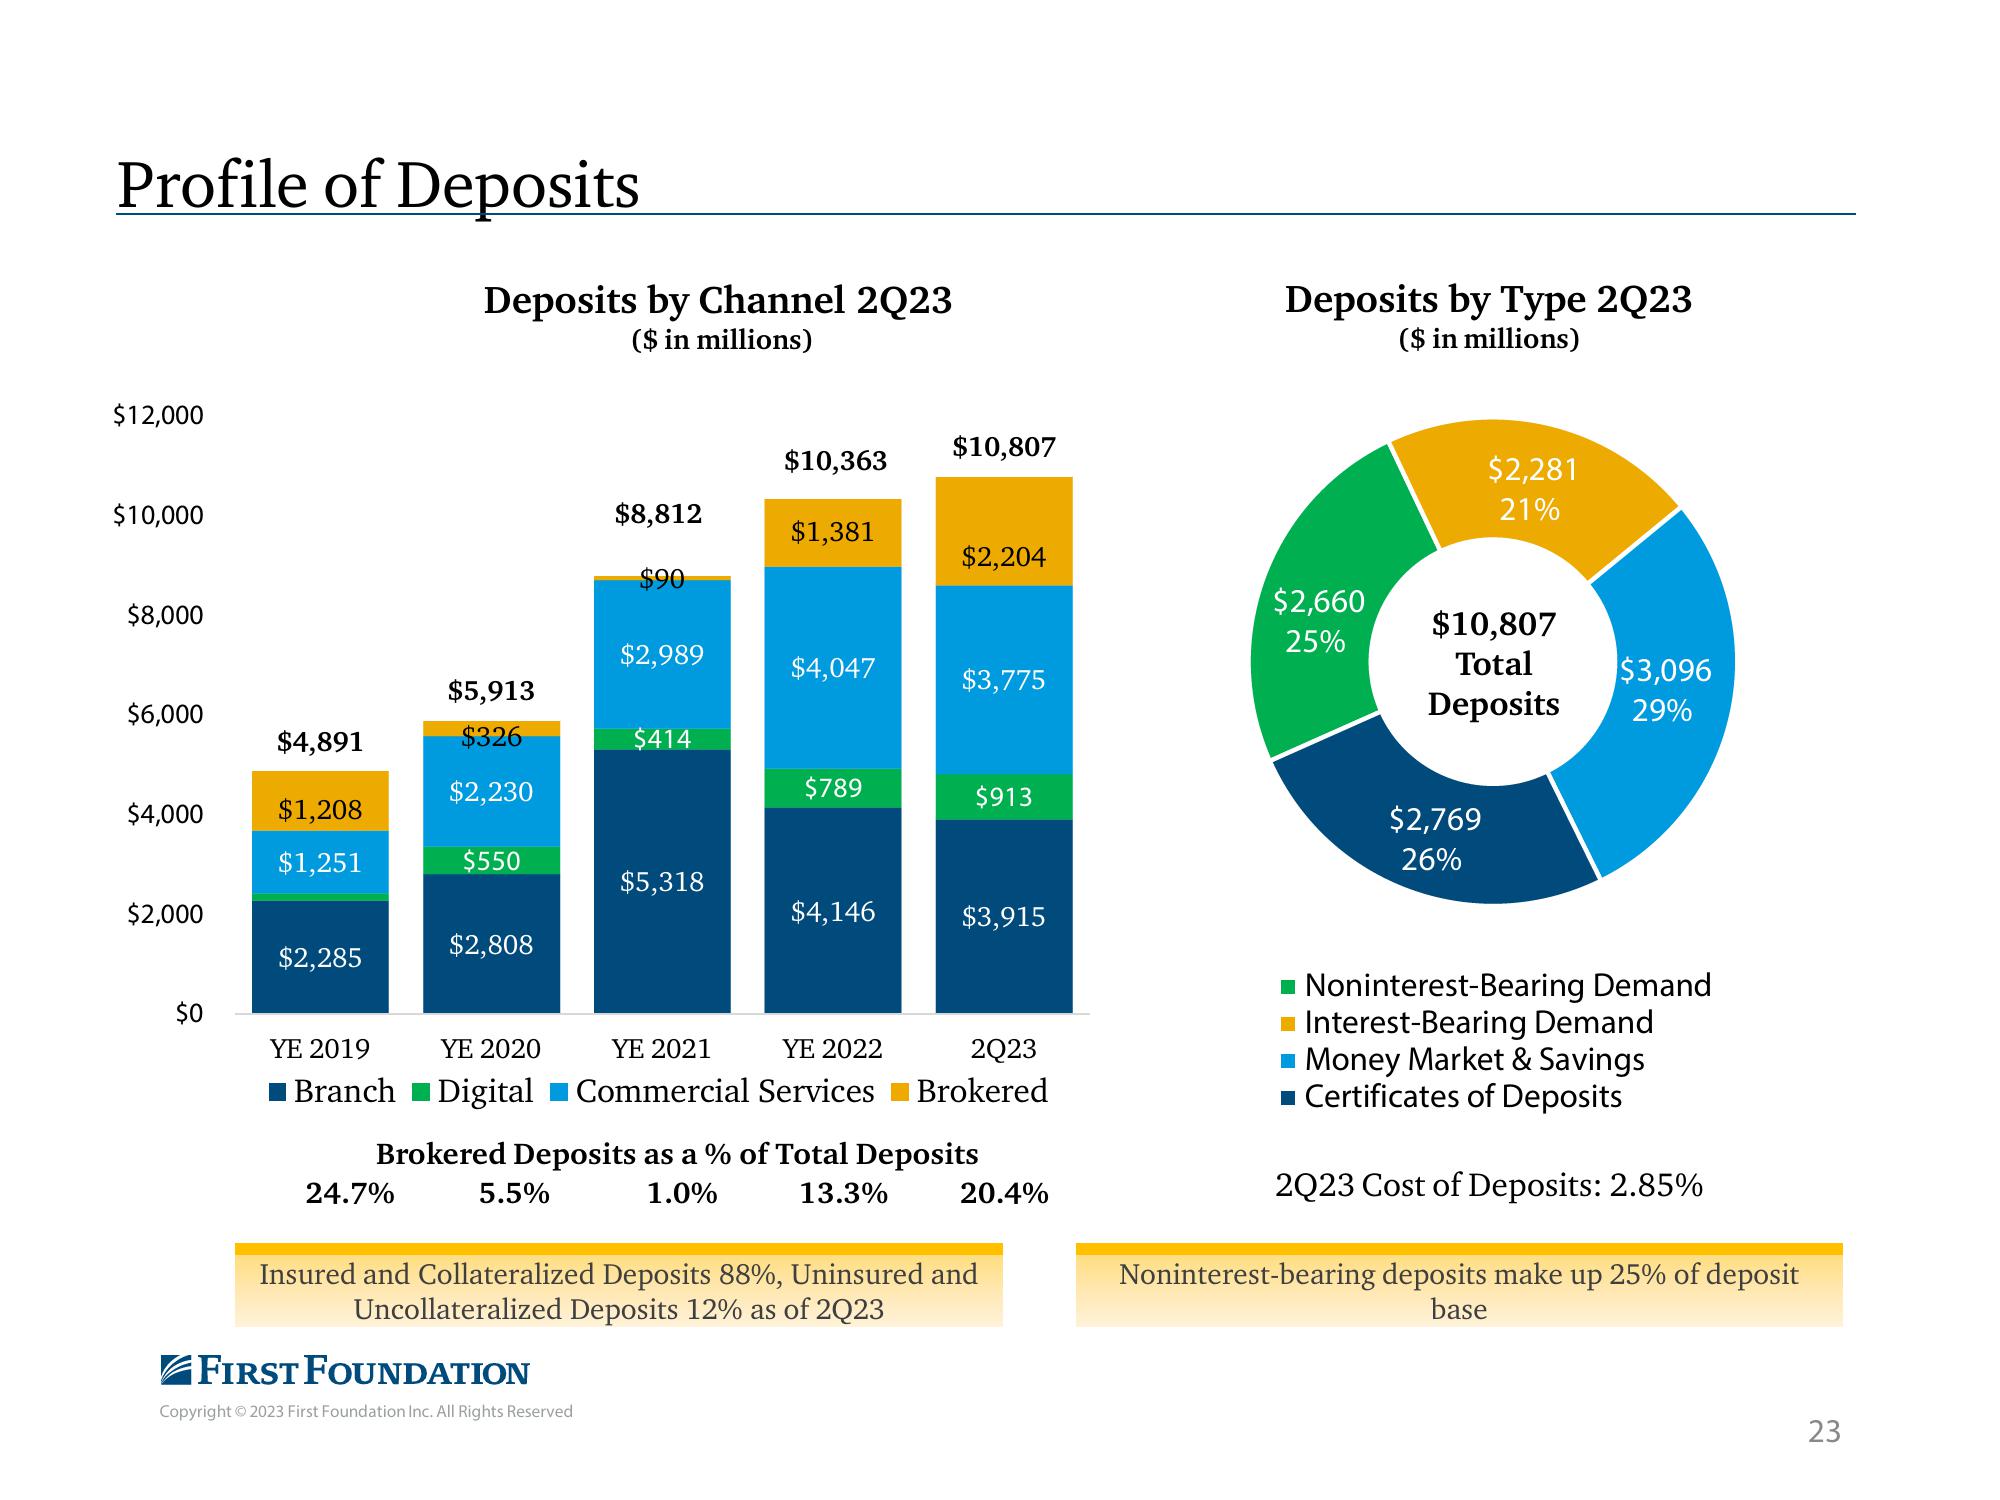
Deposits by Channel 2Q23
($ in millions)
$5,913
$326
$2,230
24.7%
$550
$2,808
YE 2020
YE 2019
■Branch Digital
5.5%
$8,812
$90
FIRST FOUNDATION
Copyright © 2023 First Foundation Inc. All Rights Reserved
$2,989
$414
$5,318
$10,363
$1,381
$4,047
$789
$4,146
$10,807
$2,204
$3,775
$913
Brokered Deposits as a % of Total Deposits
1.0%
13.3%
$3,915
YE 2021
YE 2022
2Q23
Commercial Services Brokered
20.4%
Insured and Collateralized Deposits 88%, Uninsured and
Uncollateralized Deposits 12% as of 2Q23
Deposits by Type 2Q23
($ in millions)
$2,660
25%
$2,281
21%
$10,807
Total
$3,096
Deposits 29%
$2,769
26%
■ Noninterest-Bearing Demand
Interest-Bearing Demand
■ Money Market & Savings
■ Certificates of Deposits
2Q23 Cost of Deposits: 2.85%
Noninterest-bearing deposits make up 25% of deposit
base
23View entire presentation