Bank of America Investment Banking Pitch Book
Preliminary Valuation Considerations
Preliminary Discounted Cash Flow Analysis
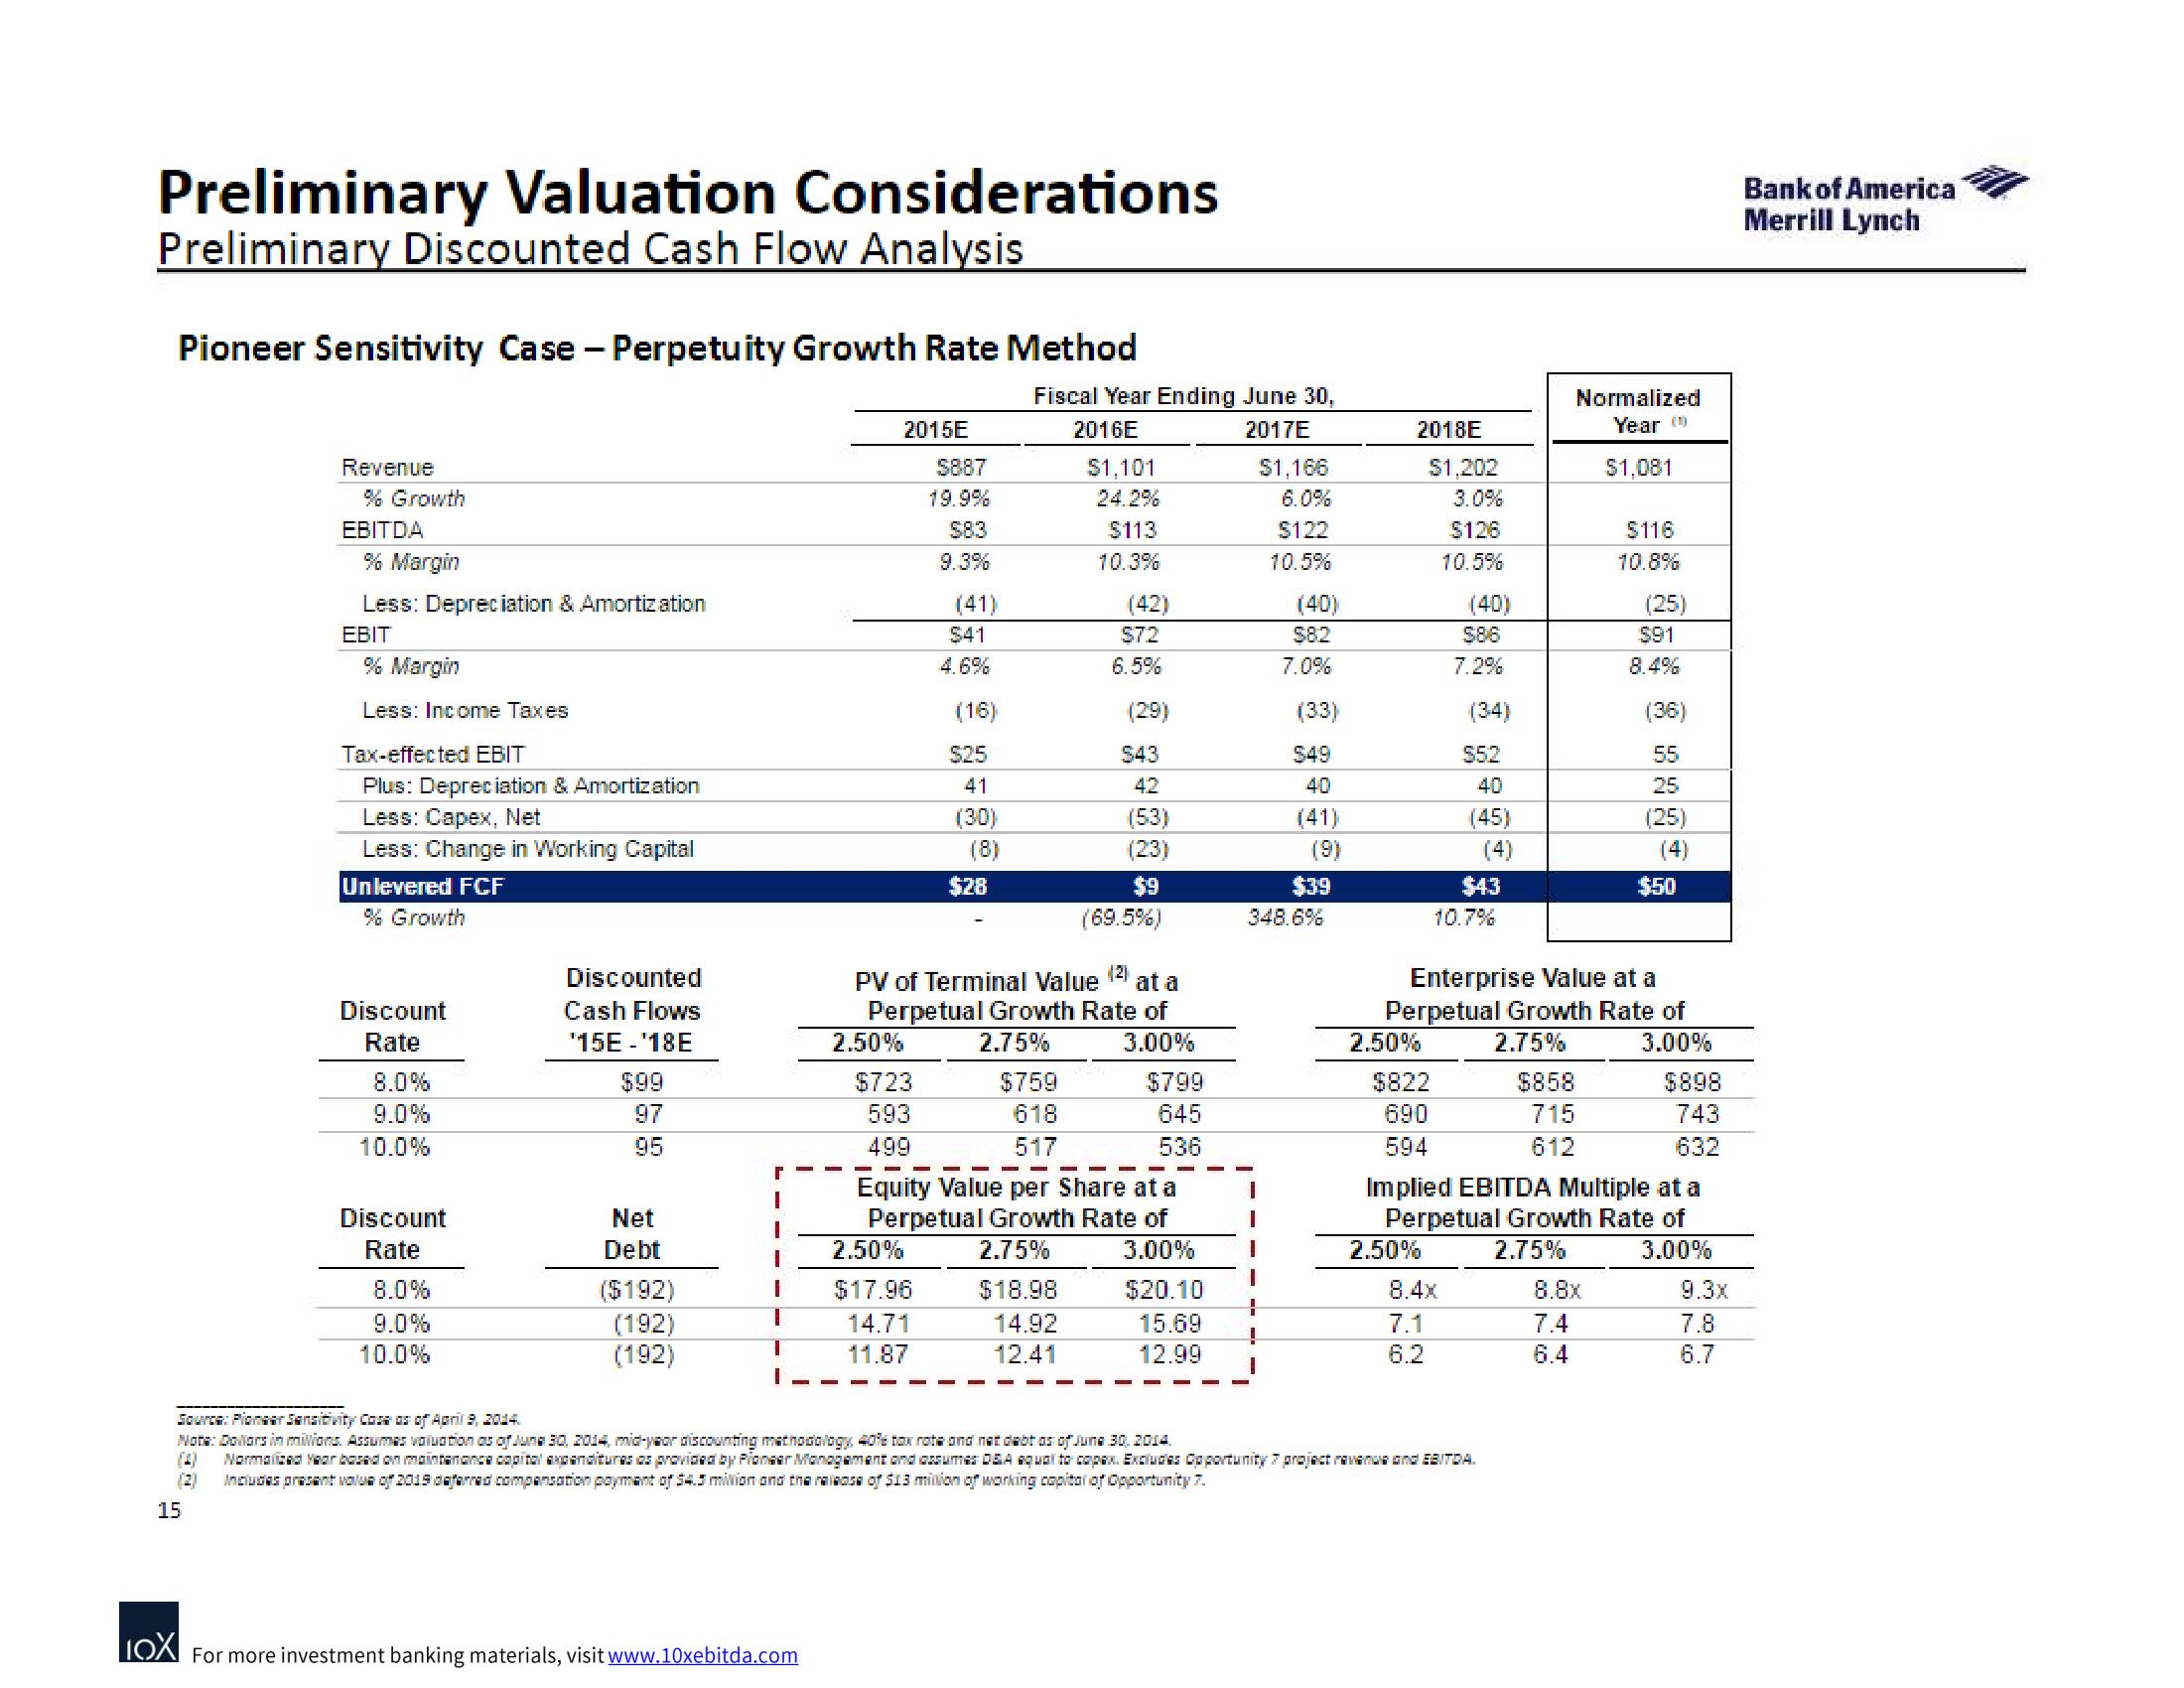
Pioneer Sensitivity Case - Perpetuity Growth Rate Method
Revenue
% Growth
EBITDA
% Margin
Less: Depreciation & Amortization
EBIT
% Margin
Less: Income Taxes
Tax-effected EBIT
Plus: Depreciation & Amortization
Less: Capex, Net
Less: Change in Working Capital
Unlevered FCF
% Growth
Discount
Rate
8.0%
9.0%
10.0%
Discount
Rate
8.0%
9.0%
10.0%
Discounted
Cash Flows
'15E - '18E
$99
97
95
Net
Debt
($192)
(192)
(192)
1
I
I
LOX For more investment banking materials, visit www.10xebitda.com
2015E
2.50%
$723
593
499
$887
19.9%
$83
9.3%
(41)
2.50%
$17.96
14.71
11.87
$41
4.6%
(16)
$25
41
(30)
(8)
$28
Fiscal Year Ending June 30,
2016E
2017E
$759
618
517
$1,101
24.2%
$113
10.3%
(2)
PV of Terminal Value at a
Perpetual Growth Rate of
2.75%
3.00%
(42)
$18.98
14.92
12.41
$7.2
6.5%
(29)
$43
42
(53)
(23)
$9
(69.5%)
Equity Value per Share at a
Perpetual Growth Rate of
2.75% 3.00%
$799
645
536
$20.10
15.69
12.99
$1,166
6.0%
$122
10.5%
1
(40)
$82
7.0%
(33)
$49
40
(41)
(9)
$39
348.6%
2018E
2.50%
$1,202
3.0%
$126
10.5%
$822
690
594
2.50%
(40)
S86
7.2%
(34)
8.4x
7.1
6.2
$52
40
(45)
$43
10.7%
Source: Pioneer Sensitivity Cose as of April 9, 2014.
Note: Dollars in milions. Assumes valuation as of June 30, 2014, mid-year discounting methodology 40% tax rate and net debt as of June 30, 2014.
(3) Normalized Year based on maintenance capital axpenditures as provided by Pioneer Management and assumes D&A equal to capax. Excludes Opportunity 7 project revenue and EBITDA.
(2) Includes present value of 2019 deferred compensation payment of 54.5 million and the release of $13 million of working capital of Opportunity 7.
15
Normalized
Year (
$1,081
Enterprise Value at a
Perpetual Growth Rate of
2.75%
3.00%
$858
715
612
$116
10.8%
(25)
8.8x
7.4
6.4
$91
8.4%
(36)
55
25
(25)
Implied EBITDA Multiple at a
Perpetual Growth Rate of
2.75%
3.00%
$50
$898
743
632
9.3x
7.8
6.7
Bank of America
Merrill LynchView entire presentation