Enfusion Results Presentation Deck
*:enfusion
ASSETS
Current Assets:
Cash and cash equivalents
Accounts receivable, net
Prepaid expenses
Other current assets
Total current assets
Property and equipment, net
Right-of-use-assets, net
Other assets
Total assets
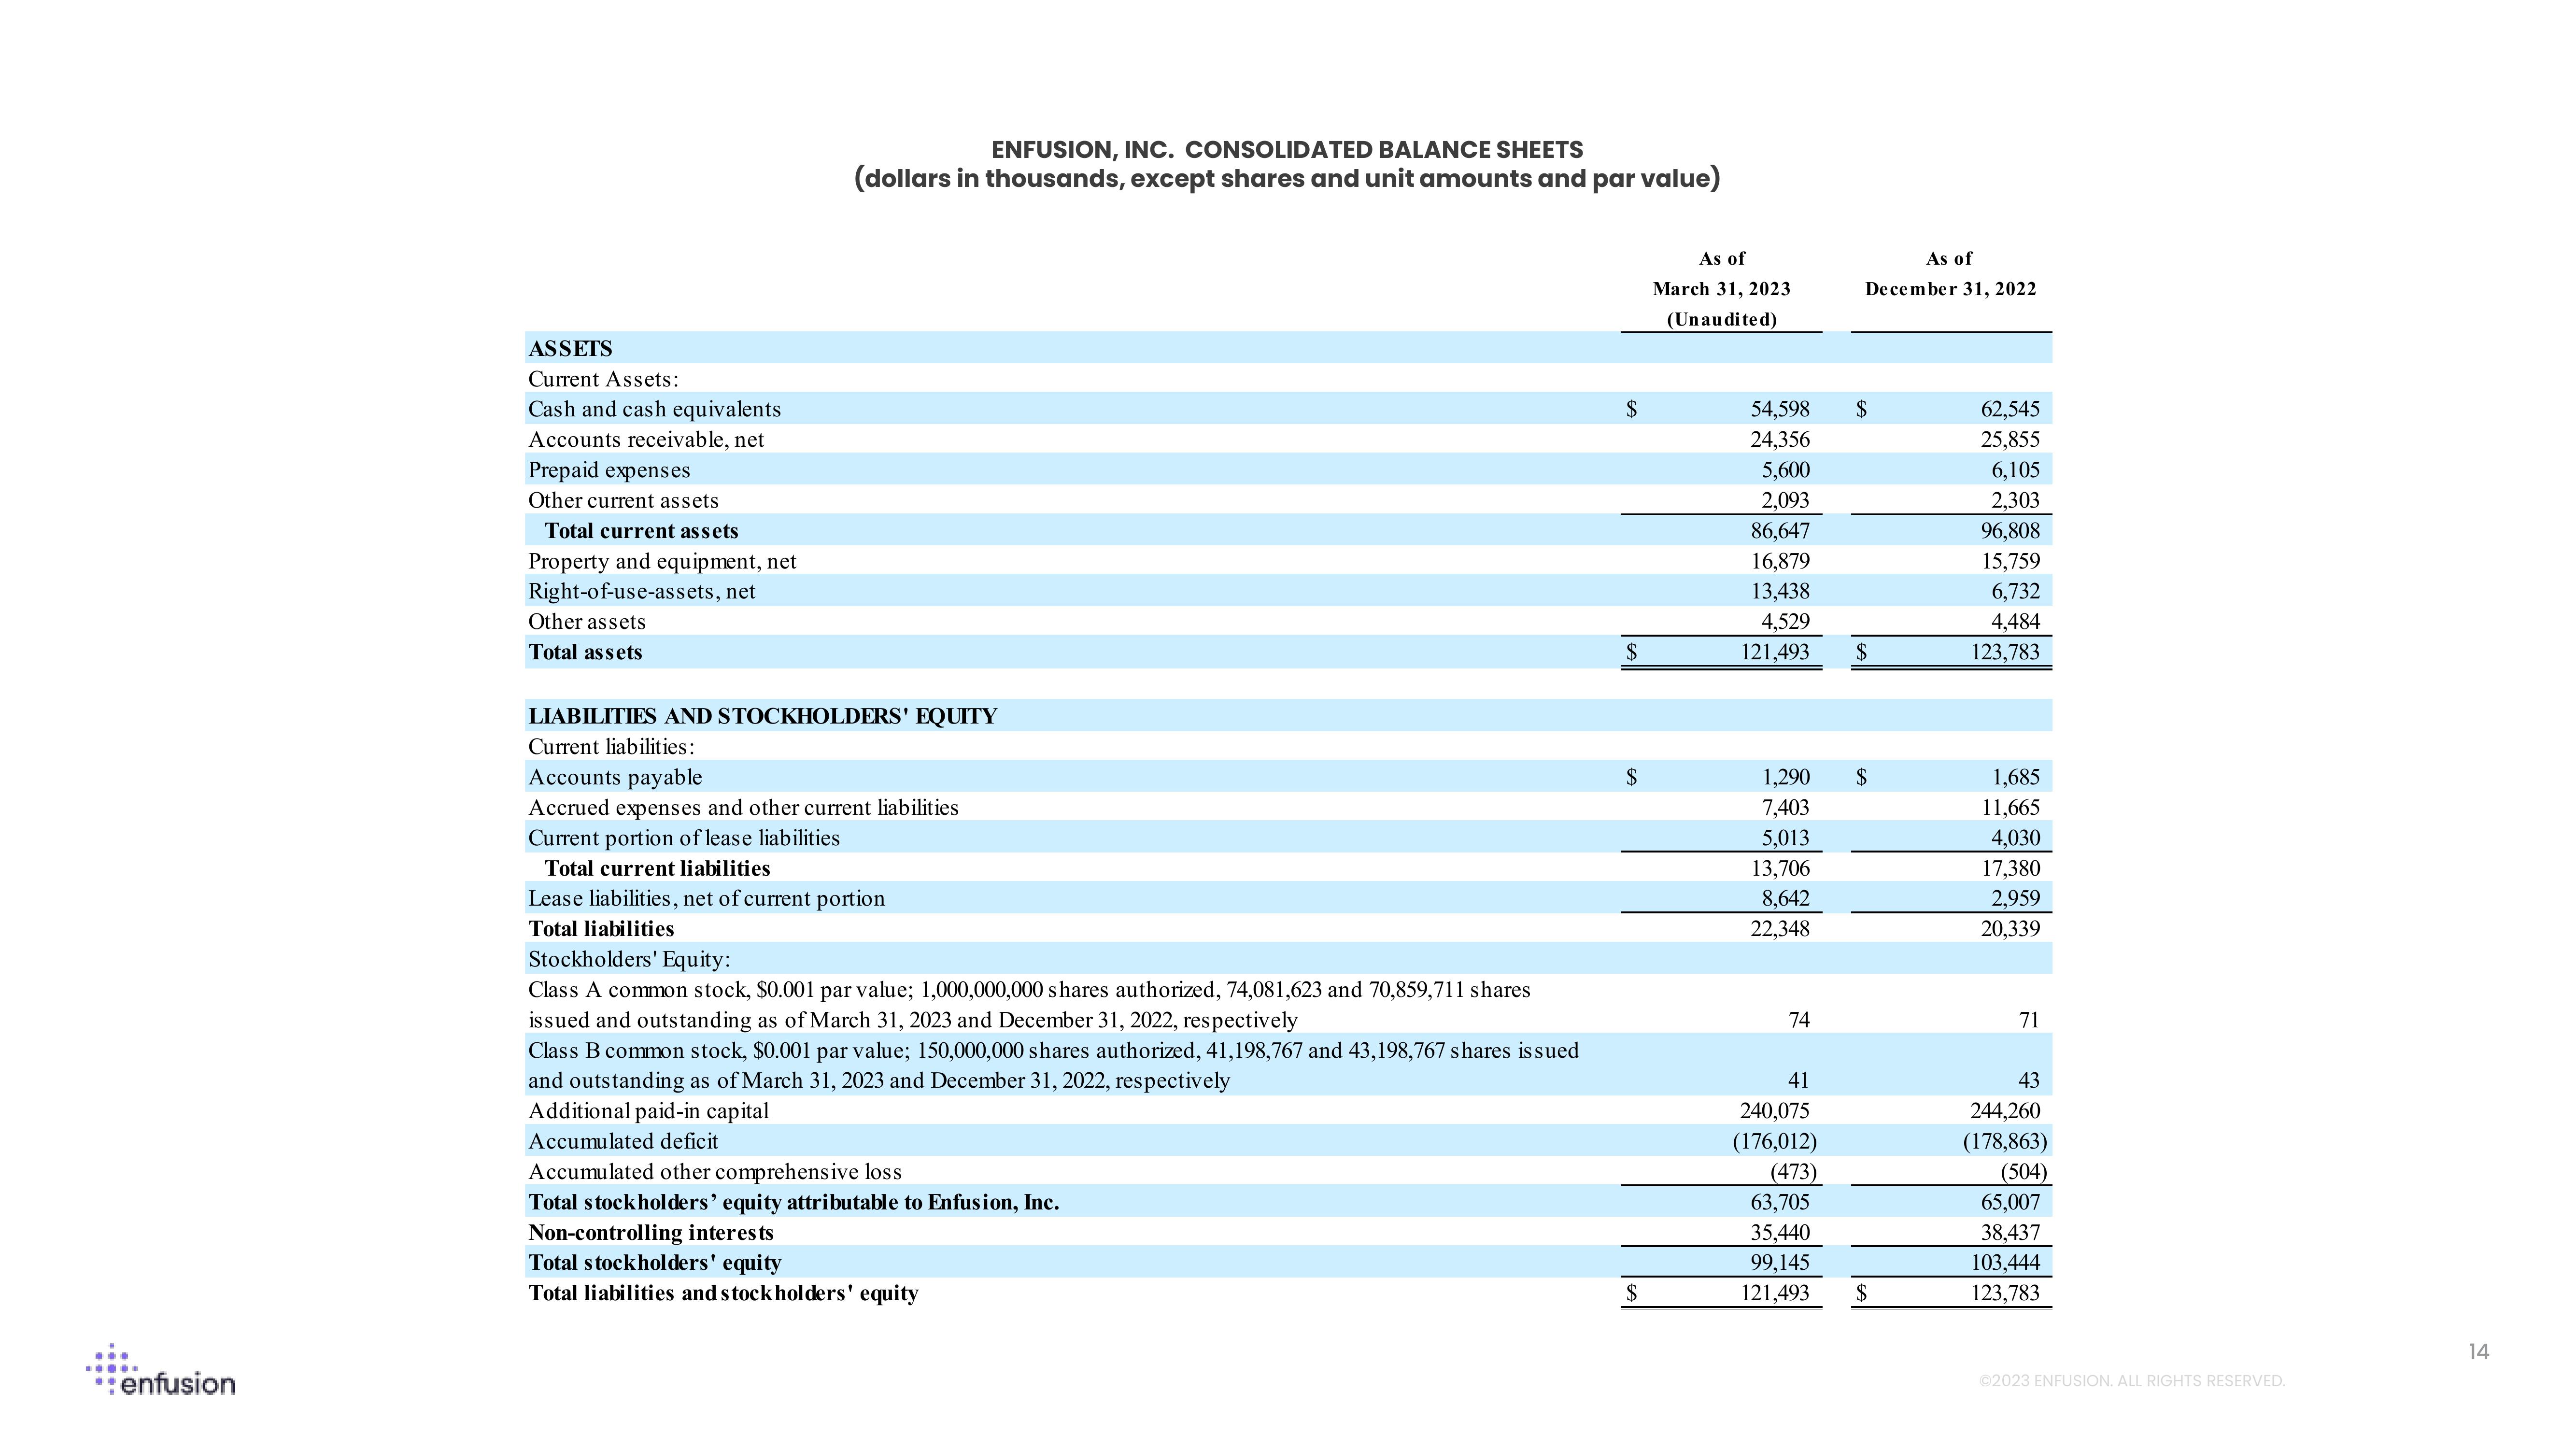
ENFUSION, INC. CONSOLIDATED BALANCE SHEETS
(dollars in thousands, except shares and unit amounts and par value)
LIABILITIES AND STOCKHOLDERS' EQUITY
Current liabilities:
Accounts payable
Accrued expenses and other current liabilities
Current portion of lease liabilities
Total current liabilities
Lease liabilities, net of current portion
Total liabilities
Stockholders' Equity:
Class A common stock, $0.001 par value; 1,000,000,000 shares authorized, 74,081,623 and 70,859,711 shares
issued and outstanding as of March 31, 2023 and December 31, 2022, respectively
Class B common stock, $0.001 par value; 150,000,000 shares authorized, 41,198,767 and 43,198,767 shares issued
and outstanding as of March 31, 2023 and December 31, 2022, respectively
Additional paid-in capital
Accumulated deficit
Accumulated other comprehensive loss
Total stockholders' equity attributable to Enfusion, Inc.
Non-controlling interests
Total stockholders' equity
Total liabilities and stockholders' equity
$
$
$
S
As of
March 31, 2023
(Unaudited)
54,598
24,356
5,600
2,093
86,647
16,879
13,438
4,529
121,493
1,290
7,403
5,013
13,706
8,642
22,348
74
41
240,075
(176,012)
(473)
63,705
35,440
99,145
121,493
As of
December 31, 2022
$
$
$
$
62,545
25,855
6,105
2,303
96,808
15,759
6,732
4,484
123,783
1,685
11,665
4,030
17,380
2,959
20,339
71
43
244,260
(178,863)
(504)
65,007
38,437
103,444
123,783
Ⓒ2023 ENFUSION. ALL RIGHTS RESERVED.
14View entire presentation