Uber Results Presentation Deck
Mobility Highlights
$ in Millions
Gross
Bookings
% Constant Currency
Growth YoY
Revenue
% Constant Currency
Growth YoY
Adjusted
EBITDA
Uber
Q3 2021 Earnings
$5,905
(50%)
23.1%
O
$1,364
(51%)
4.1%
O
$245
$6,789
(47%)
21.7%
$1,471
(51%)
4.3%
$293
$6,773
(36%)
12.6%*
$853*
(63%)
4.4%
$298
Q1 2021
$8,640
Note 1: Take Rate is defined as Revenue as a percentage of Gross Bookings.
Note 2: See Non-GAAP reconciliations for reconciliation of non-GAAP measures.
Note 3: All measures are for Mobility segment unless otherwise noted.
174%
18.7%
$1,617
98%
2.1%
$179
$9,883
Q2 2021
63%
22.3%*
$2,205*
59%
5.5%
O
$544
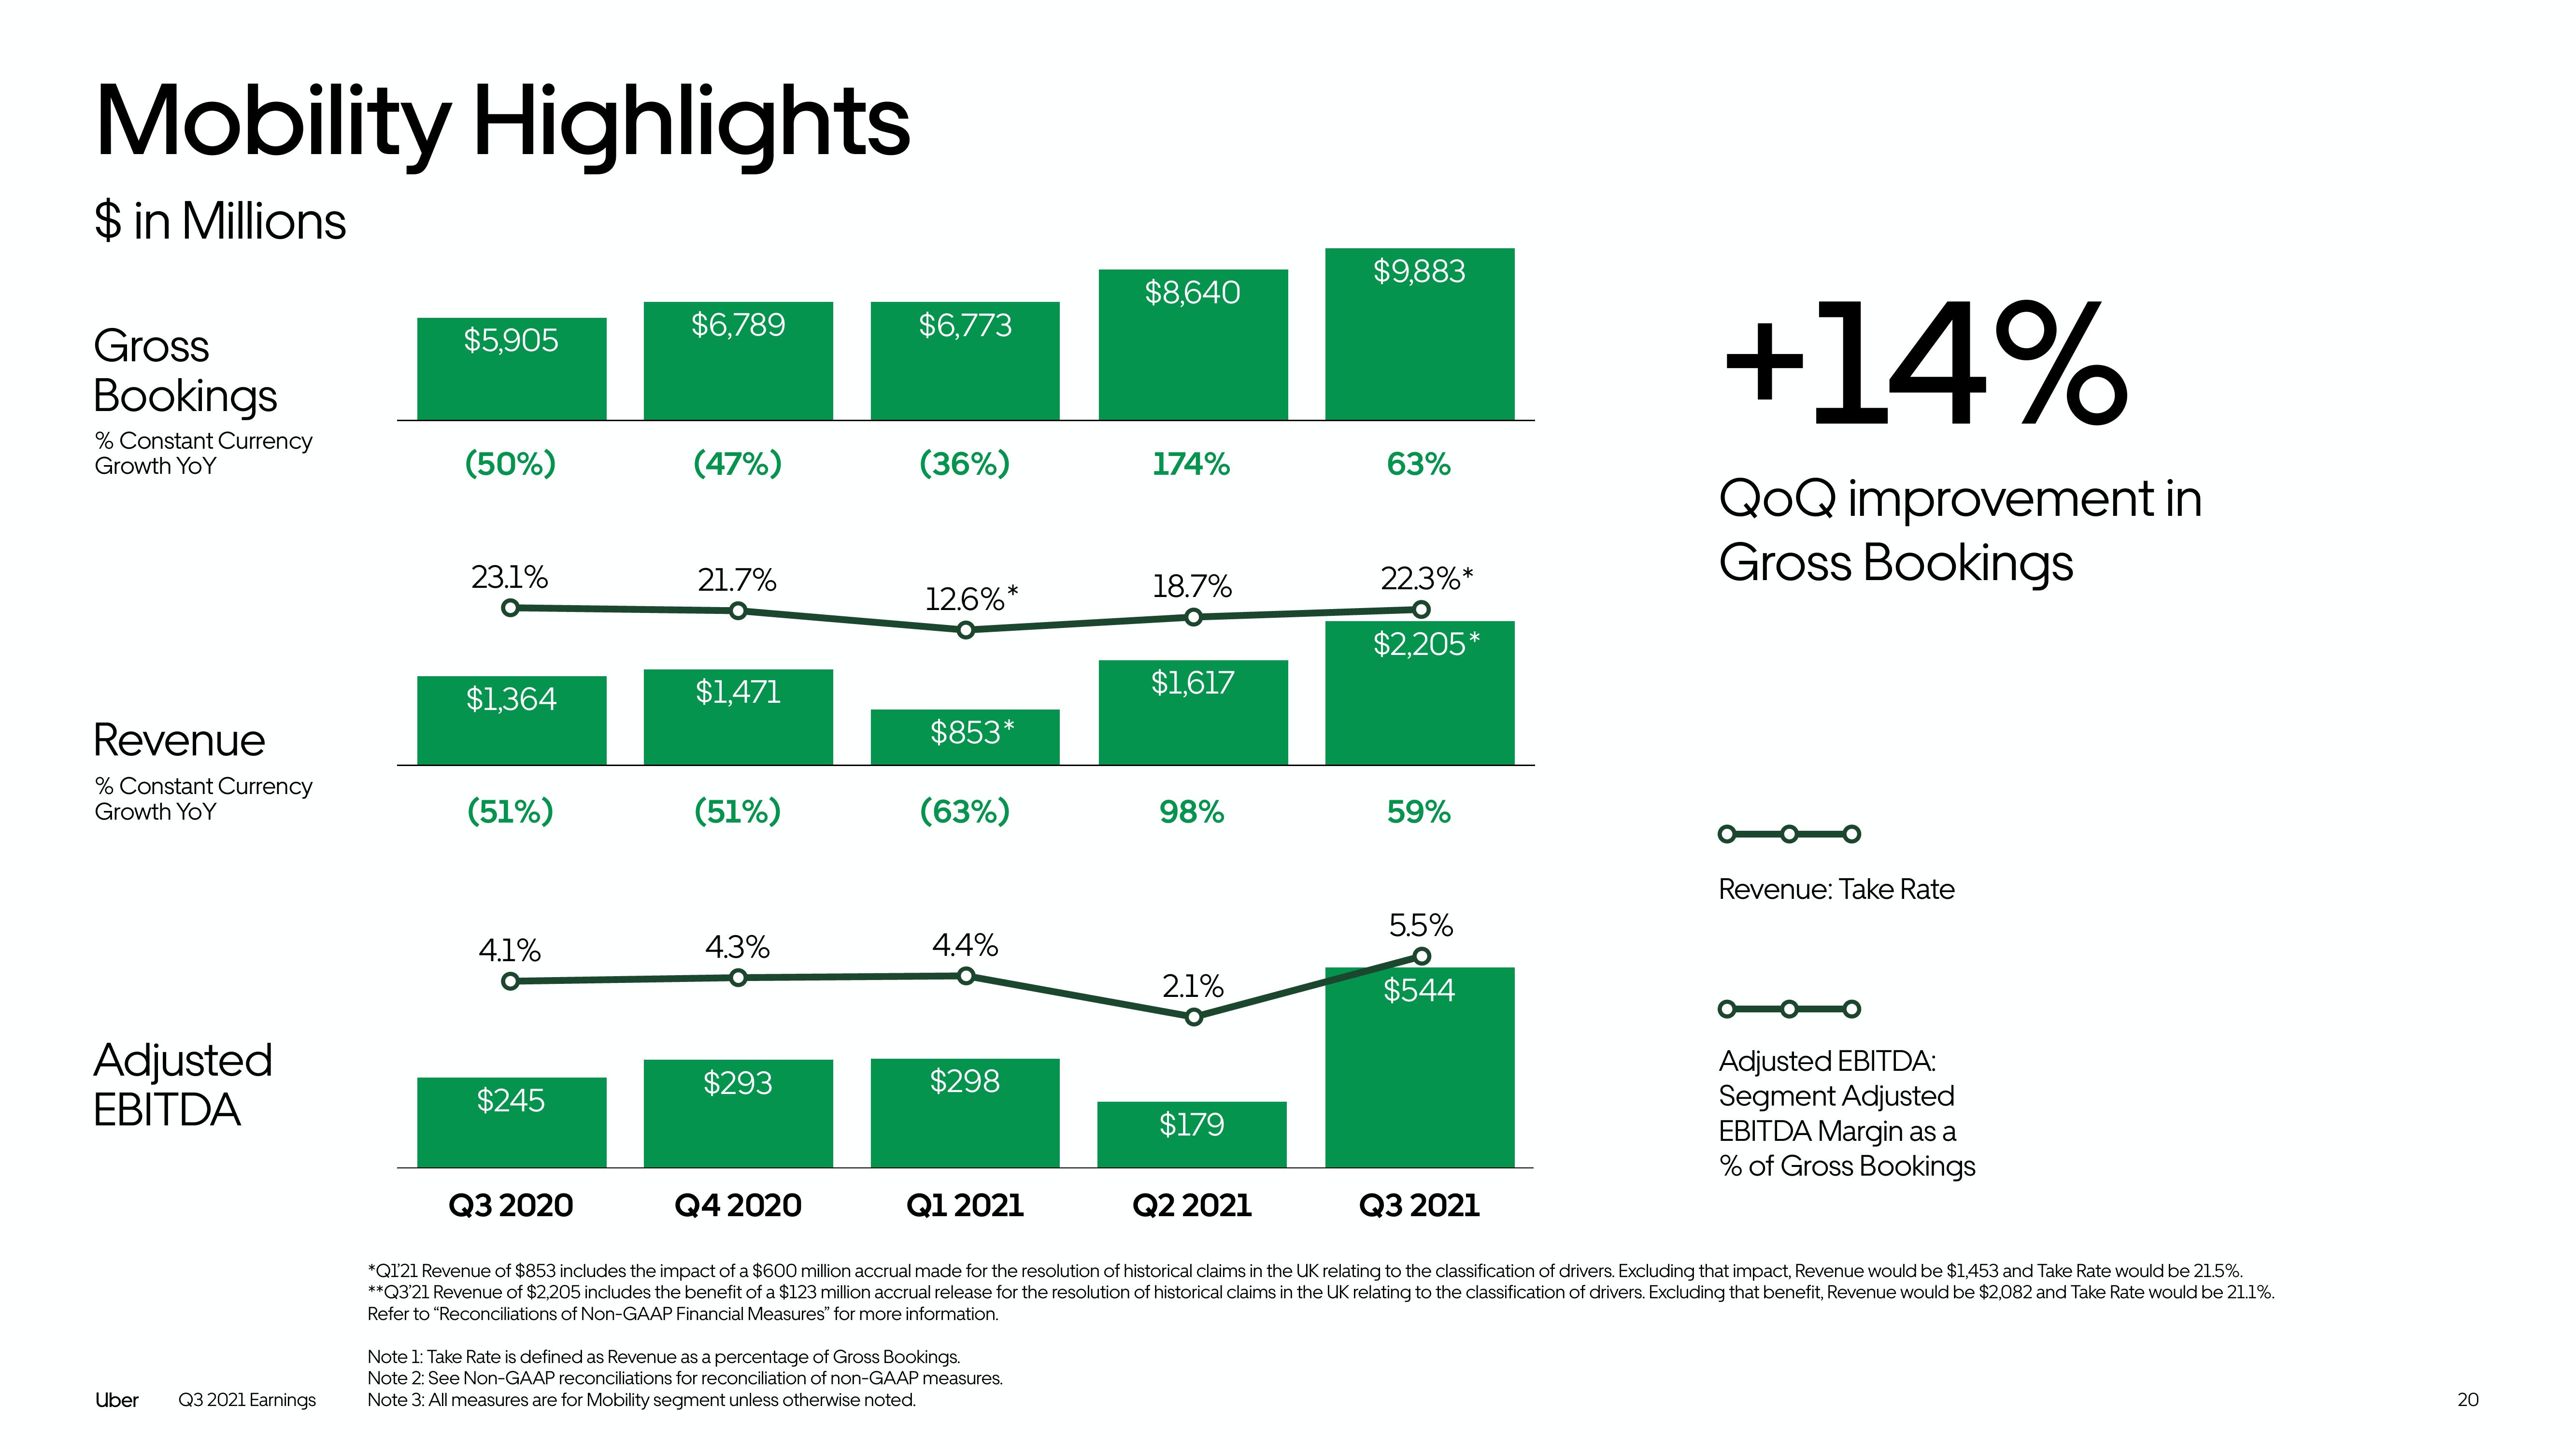
+14%
QoQ improvement in
Gross Bookings
Q3 2020
Q4 2020
Q3 2021
*Q1'21 Revenue of $853 includes the impact of a $600 million accrual made for the resolution of historical claims in the UK relating to the classification of drivers. Excluding that impact, Revenue would be $1,453 and Take Rate would be 21.5%.
**Q3'21 Revenue of $2,205 includes the benefit of a $123 million accrual release for the resolution of historical claims in the UK relating to the classification of drivers. Excluding that benefit, Revenue would be $2,082 and Take Rate would be 21.1%.
Refer to "Reconciliations of Non-GAAP Financial Measures" for more information.
Revenue: Take Rate
Adjusted EBITDA:
Segment Adjusted
EBITDA Margin as a
% of Gross Bookings
20View entire presentation