Roblox Results Presentation Deck
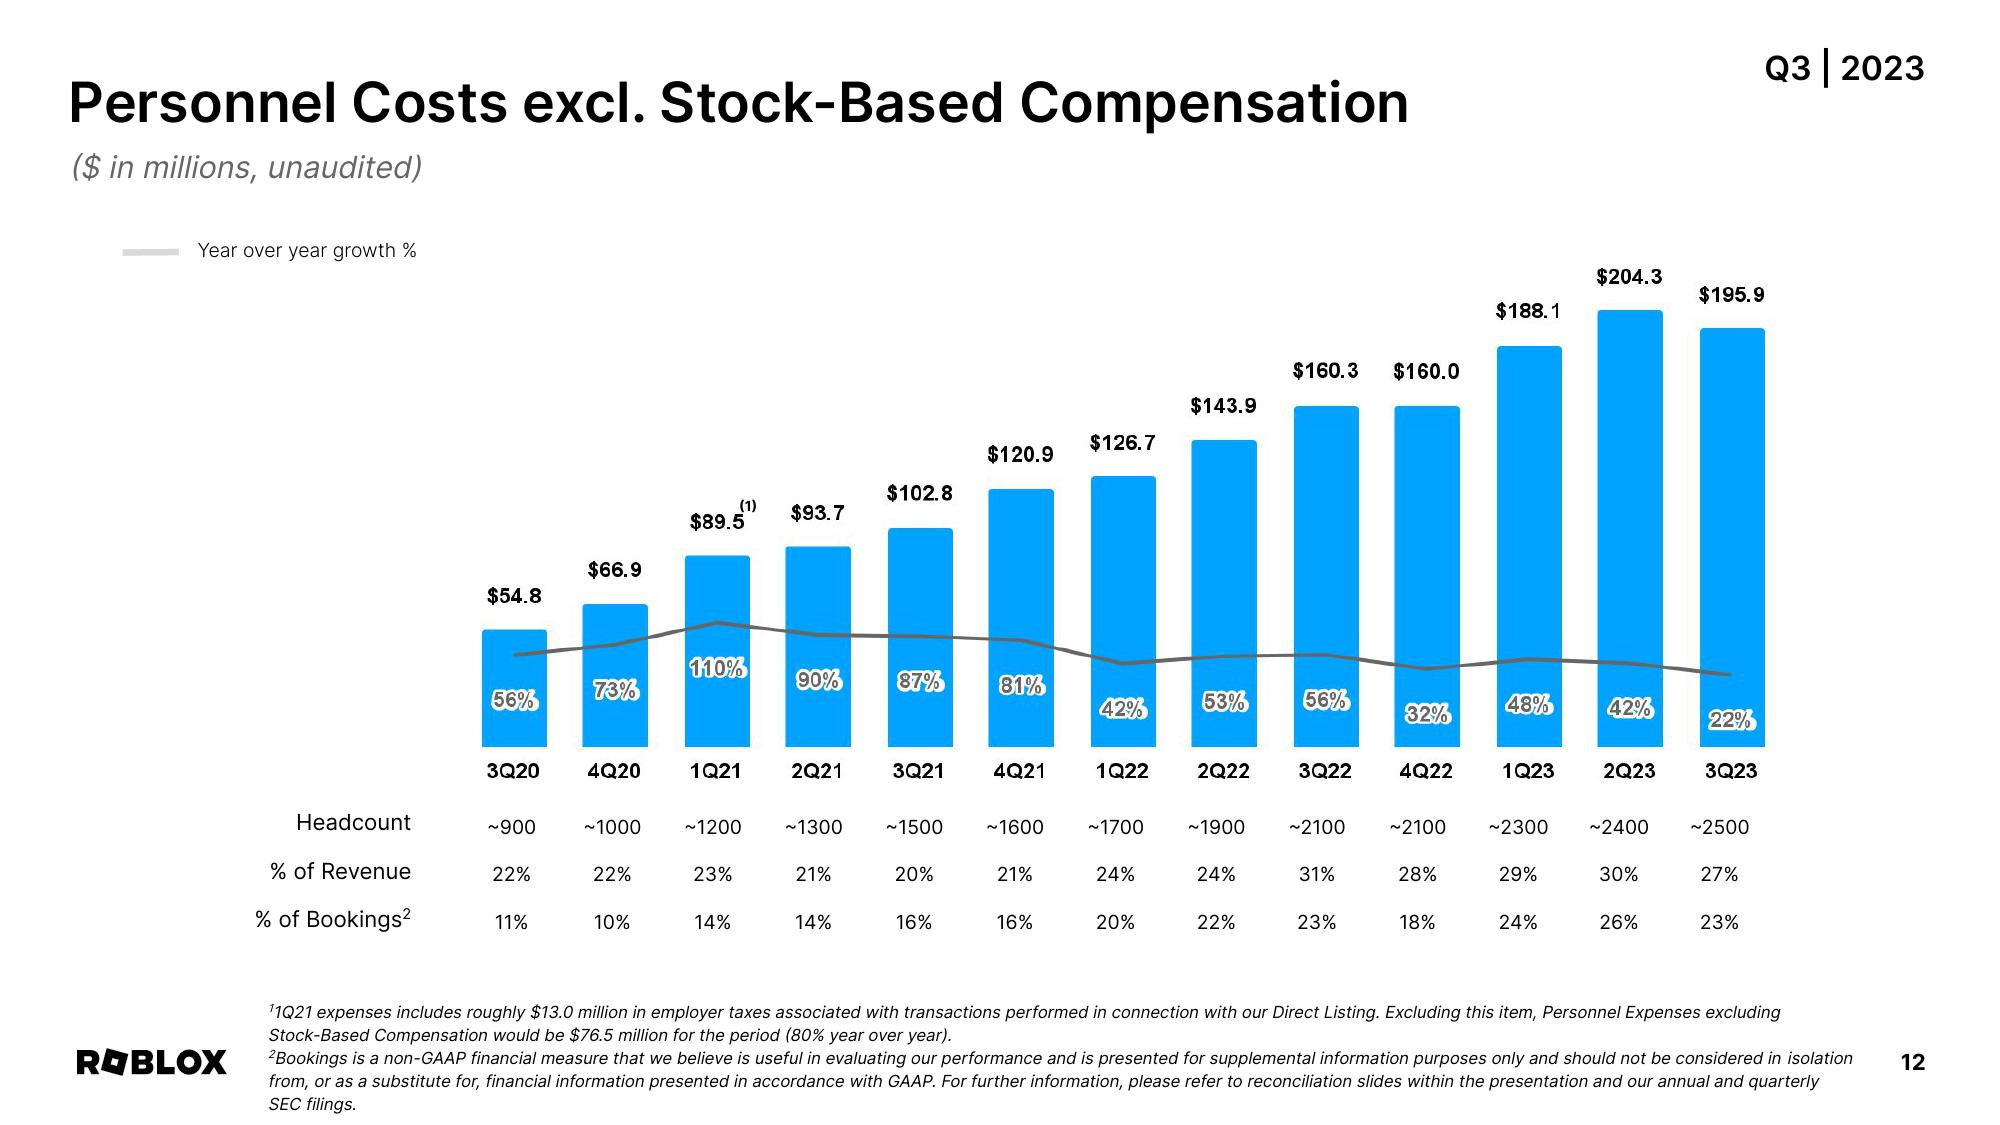
Personnel Costs excl. Stock-Based Compensation
($ in millions, unaudited)
Year over year growth %
ROBLOX
Headcount
% of Revenue
% of Bookings²
$54.8
56%
3Q20
~900
22%
11%
$66.9
73%
4Q20
~1000
22%
10%
$89.5
(1)
110%
1Q21
~1200
23%
14%
$93.7
90%
2Q21
~1300
21%
14%
$102.8
87% 81%
3Q21
~1500
20%
$120.9
16%
4Q21
~1600
16%
$126.7
42%
1Q22
~1700
24
20%
$143.9
53% 56% 32%
2Q22
~1900
24%
$160.3 $160.0
22%
3Q22
~2100
31%
23%
4Q22
~2100
28%
18%
$188.1
48%
1Q23
~2300
29%
24%
$204.3
42%
2Q23
30%
26%
$195.9
22%
~2400 ~2500
3Q23
27%
Q3 | 2023
23%
11Q21 expenses includes roughly $13.0 million in employer taxes associated with transactions performed in connection with our Direct Listing. Excluding this item, Personnel Expenses excluding
Stock-Based Compensation would be $76.5 million for the period (80% year over year).
²Bookings is a non-GAAP financial measure that we believe is useful in evaluating our performance and is presented for supplemental information purposes only and should not be considered in isolation
from, or as a substitute for, financial information presented in accordance with GAAP. For further information, please refer to reconciliation slides within the presentation and our annual and quarterly
SEC filings.
12View entire presentation