Oatly Results Presentation Deck
(USD in millions)
% Year-over-year growth
Sales
volume (¹)
Constant currency
revenue growth (5)
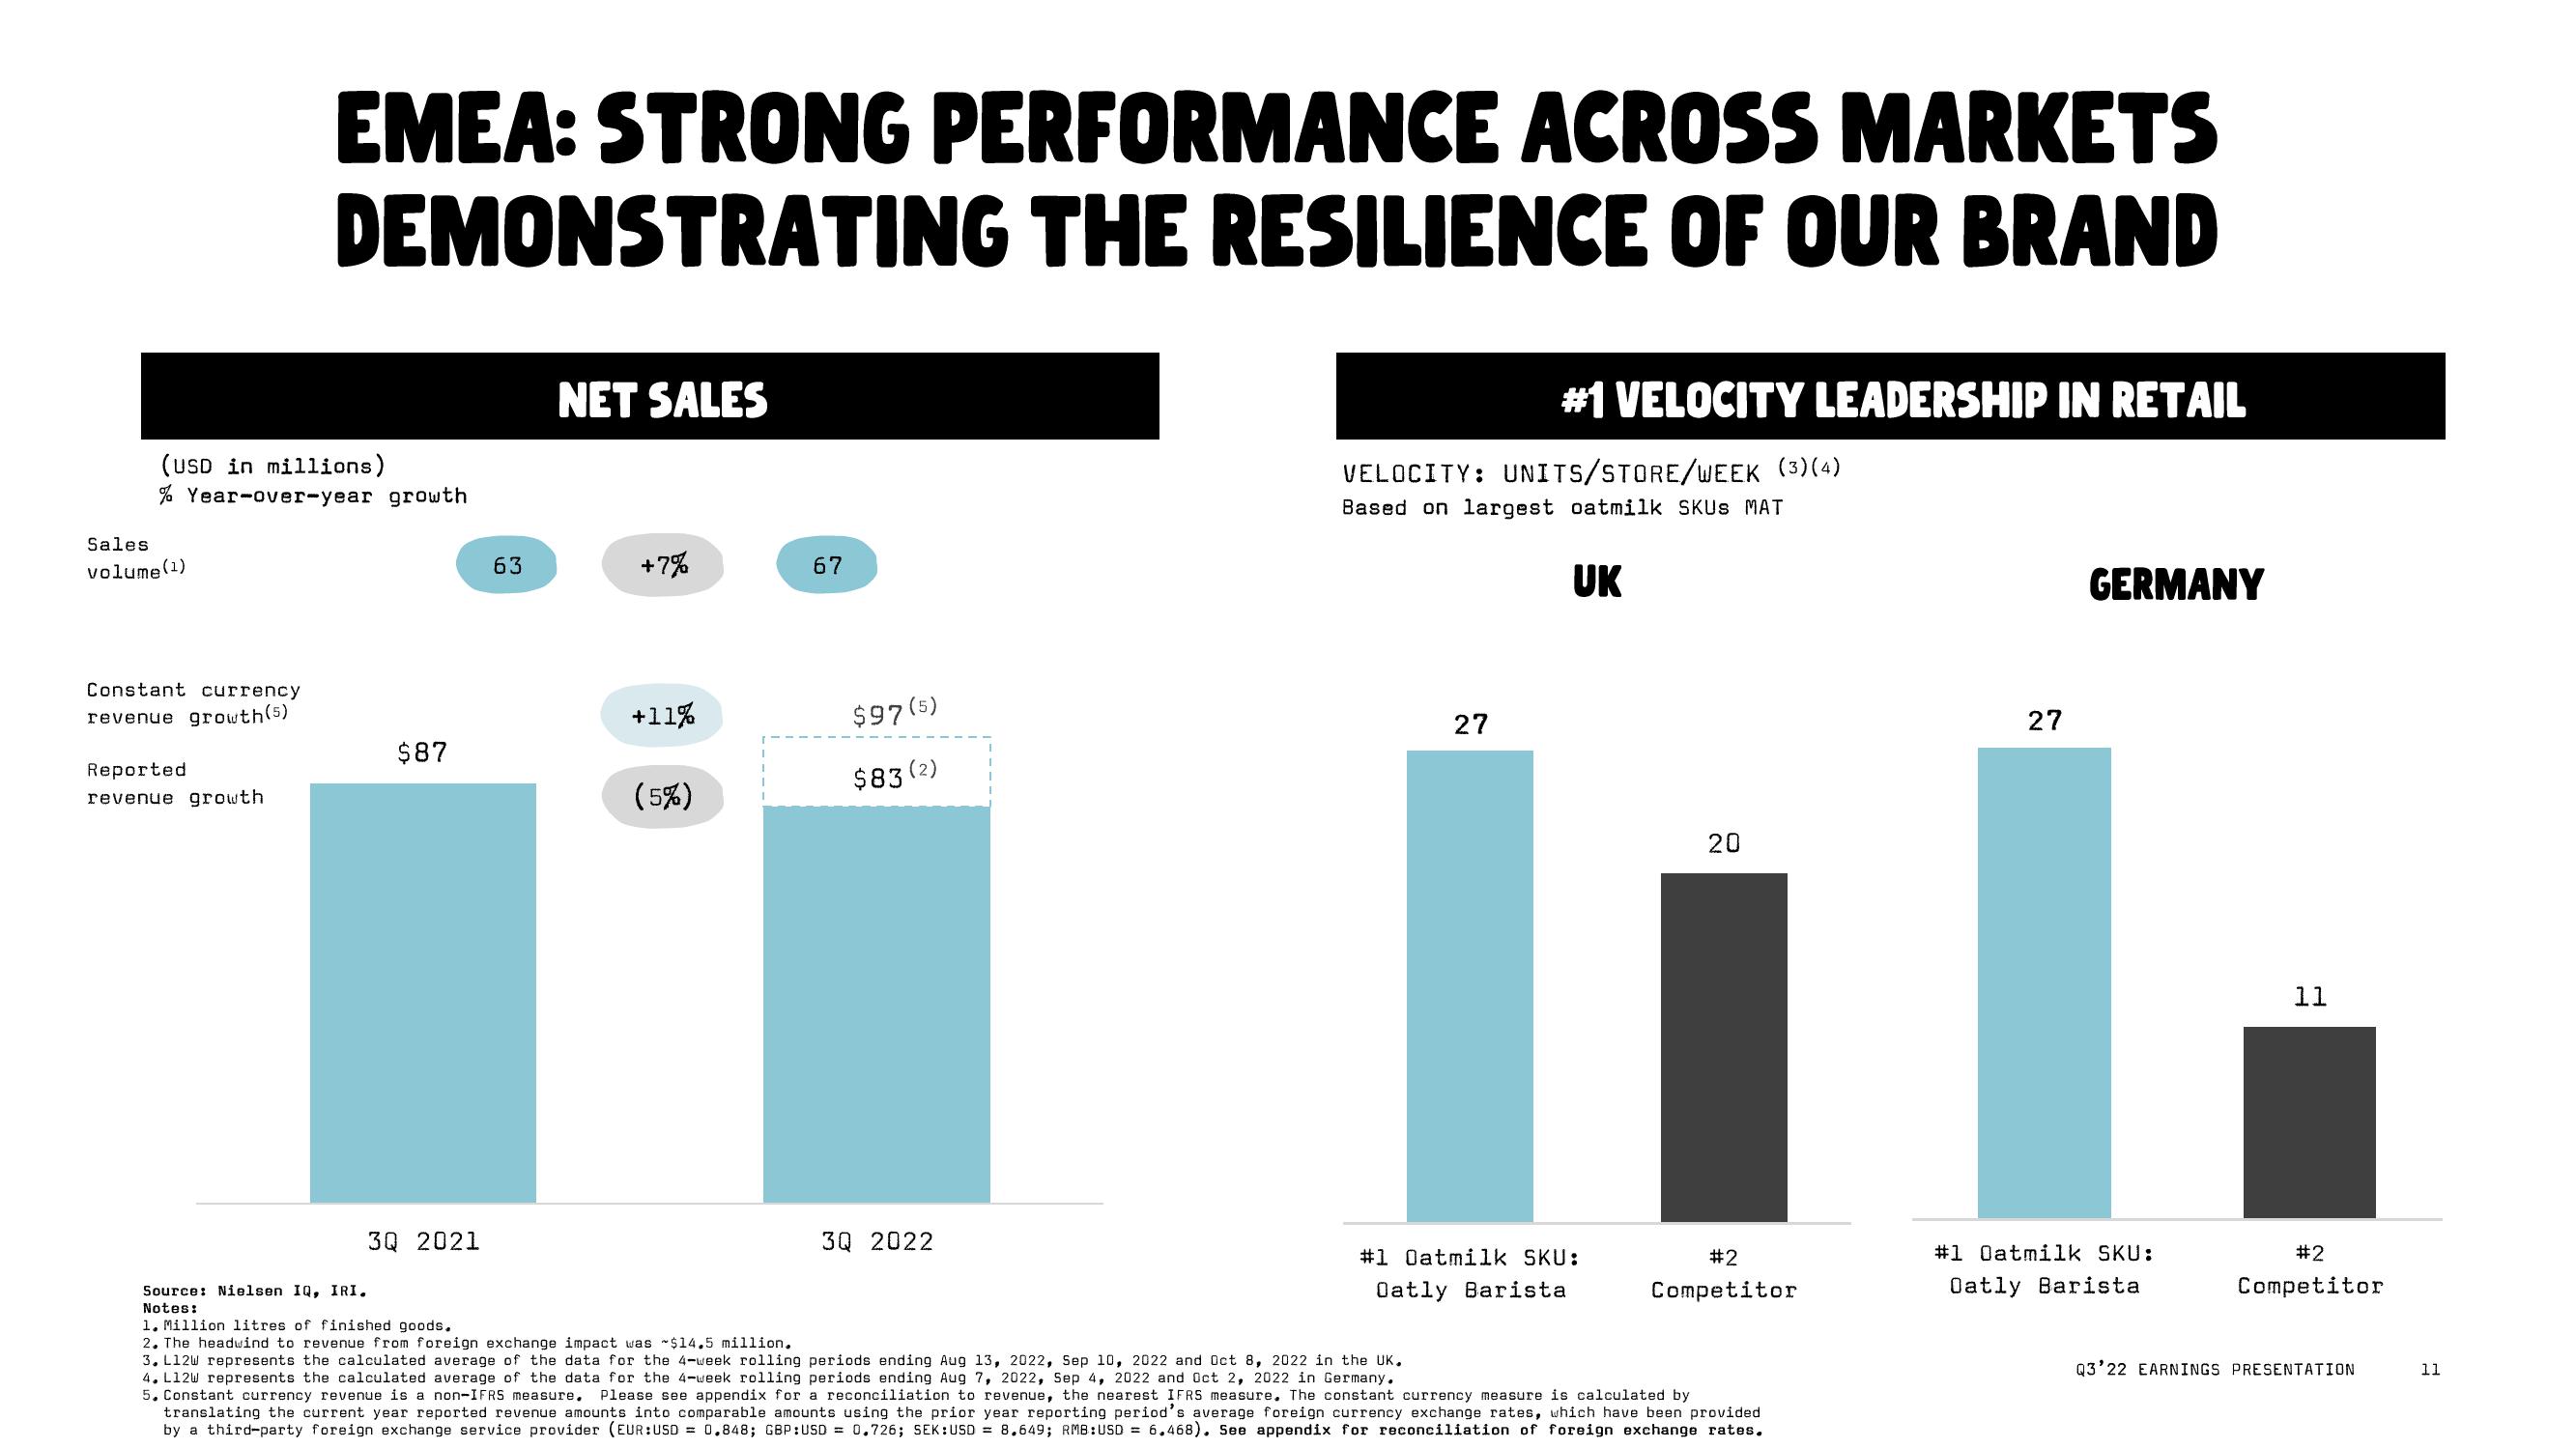
EMEA: STRONG PERFORMANCE ACROSS MARKETS
DEMONSTRATING THE RESILIENCE OF OUR BRAND
Reported
revenue growth
Source: Nielsen IQ, IRI.
Notes:
$87
3Q 2021
63
NET SALES
+7%
+11%
(5%)
67
$97 (5)
$83 (2)
3Q 2022
#1 VELOCITY LEADERSHIP IN RETAIL
VELOCITY: UNITS/STORE/WEEK (3)(4)
Based on largest oatmilk SKUS MAT
UK
27
#1 Oatmilk SKU:
Oatly Barista
20
#2
Competitor
1. Million litres of finished goods.
2. The headwind to revenue from foreign exchange impact was $14.5 million.
3. L12W represents the calculated average of the data for the 4-week rolling periods ending Aug 13, 2022, Sep 10, 2022 and Oct 8, 2022 in the UK.
4. L12W represents the calculated average of the data for the 4-week rolling periods ending Aug 7, 2022, Sep 4, 2022 and Oct 2, 2022 in Germany.
5. Constant currency revenue is non-IFRS measure. Please see appendix for a reconciliation to revenue, the nearest IFRS measure. The constant currency measure is calculated by
translating the current year reported revenue amounts into comparable amounts using the prior year reporting period's average foreign currency exchange rates, which have been provided
by a third-party foreign exchange service provider (EUR:USD = 0.848; GBP:USD = 0.726; SEK:USD = 8.649; RMB:USD = 6.468). See appendix for reconciliation of foreign exchange rates.
27
GERMANY
#1 Oatmilk SKU:
Oatly Barista
11
#2
Competitor
Q3'22 EARNINGS PRESENTATION
11View entire presentation