P3 Health Partners SPAC Presentation Deck
Right Space
Right Team
Right Model
P3's Projected Mature Market Ramp
Commentary
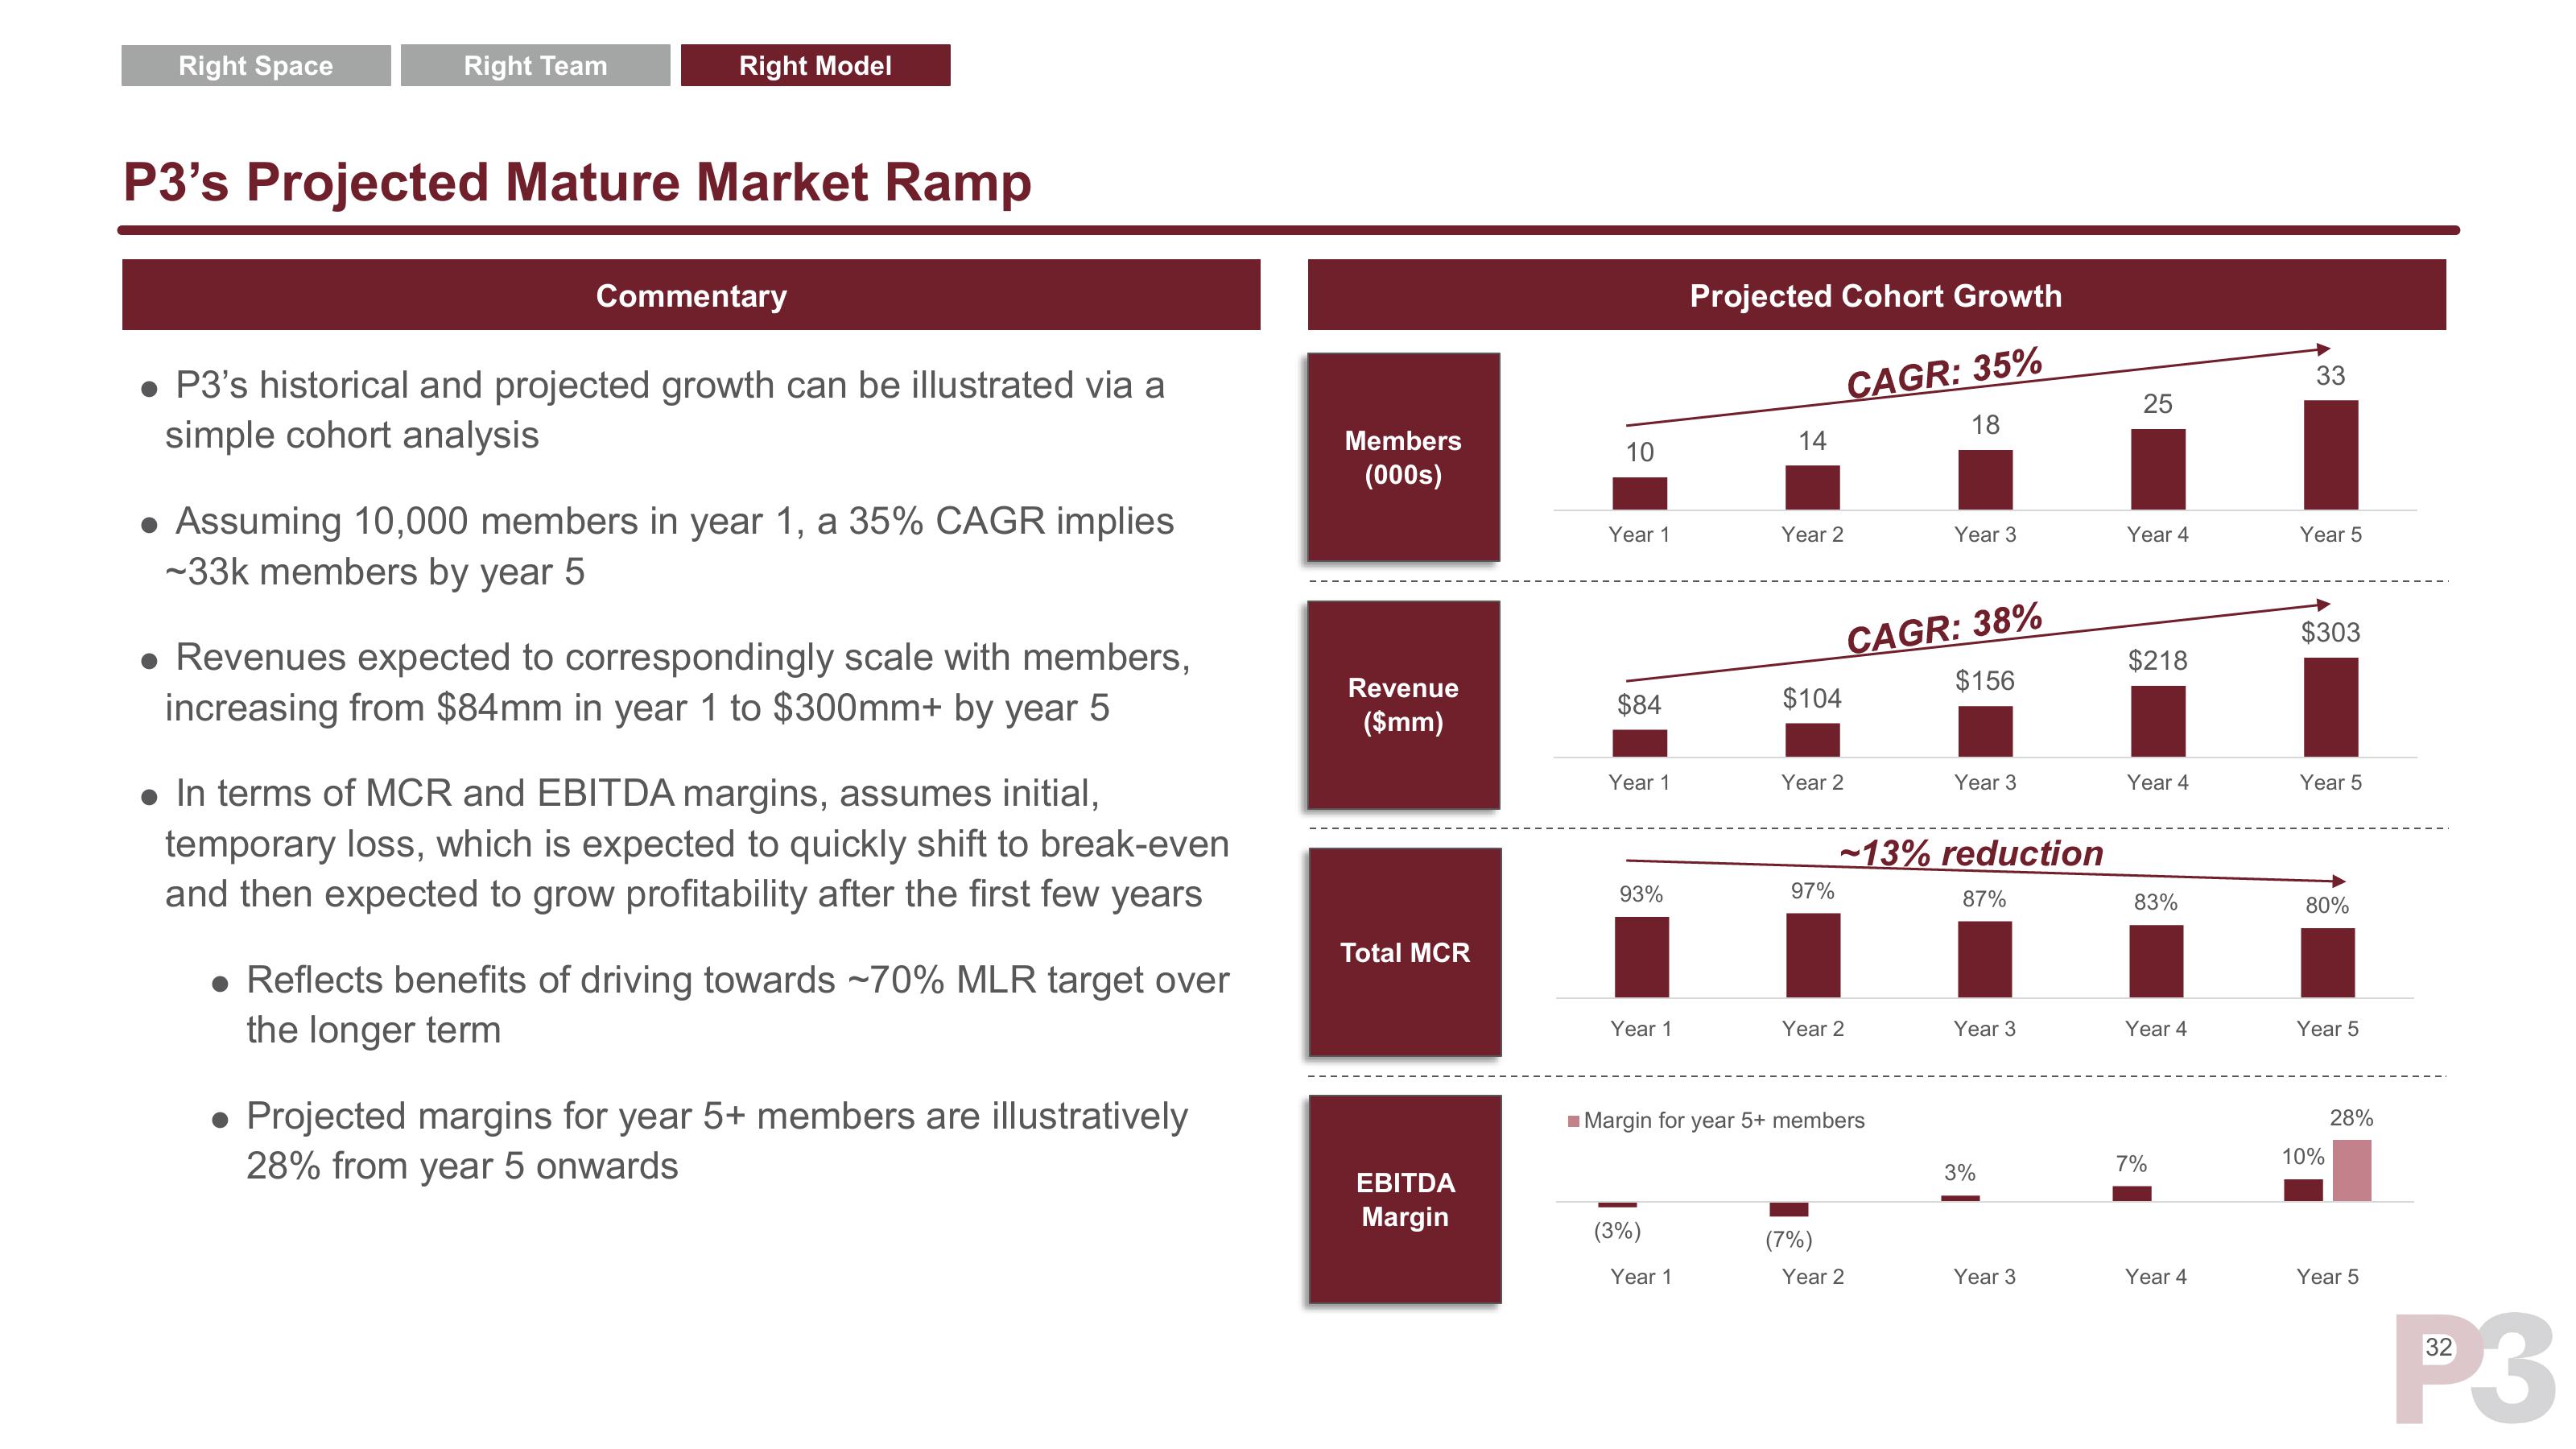
• P3's historical and projected growth can be illustrated via a
simple cohort analysis
• Assuming 10,000 members in year 1, a 35% CAGR implies
-33k members by year 5
Revenues expected to correspondingly scale with members,
increasing from $84mm in year 1 to $300mm+ by year 5
• In terms of MCR and EBITDA margins, assumes initial,
temporary loss, which is expected to quickly shift to break-even
and then expected to grow profitability after the first few years
• Reflects benefits of driving towards ~70% MLR target over
the longer term
• Projected margins for year 5+ members are illustratively
28% from year 5 onwards
Members
(000s)
Revenue
($mm)
Total MCR
EBITDA
Margin
10
Year 1
$84
Year 1
93%
Year 1
(3%)
Projected Cohort Growth
CAGR: 35%
Year 1
14
Year 2
$104
Year 2
97%
Year 2
■Margin for year 5+ members
(7%)
18
Year 2
Year 3
CAGR: 38%
$156
-13% reduction
Year 3
87%
Year 3
3%
Year 3
25
Year 4
$218
Year 4
83%
Year 4
7%
Year 4
co
33
Year 5
$303
Year 5
80%
Year 5
10%
28%
Year 5
32
P3View entire presentation