Uber Results Presentation Deck
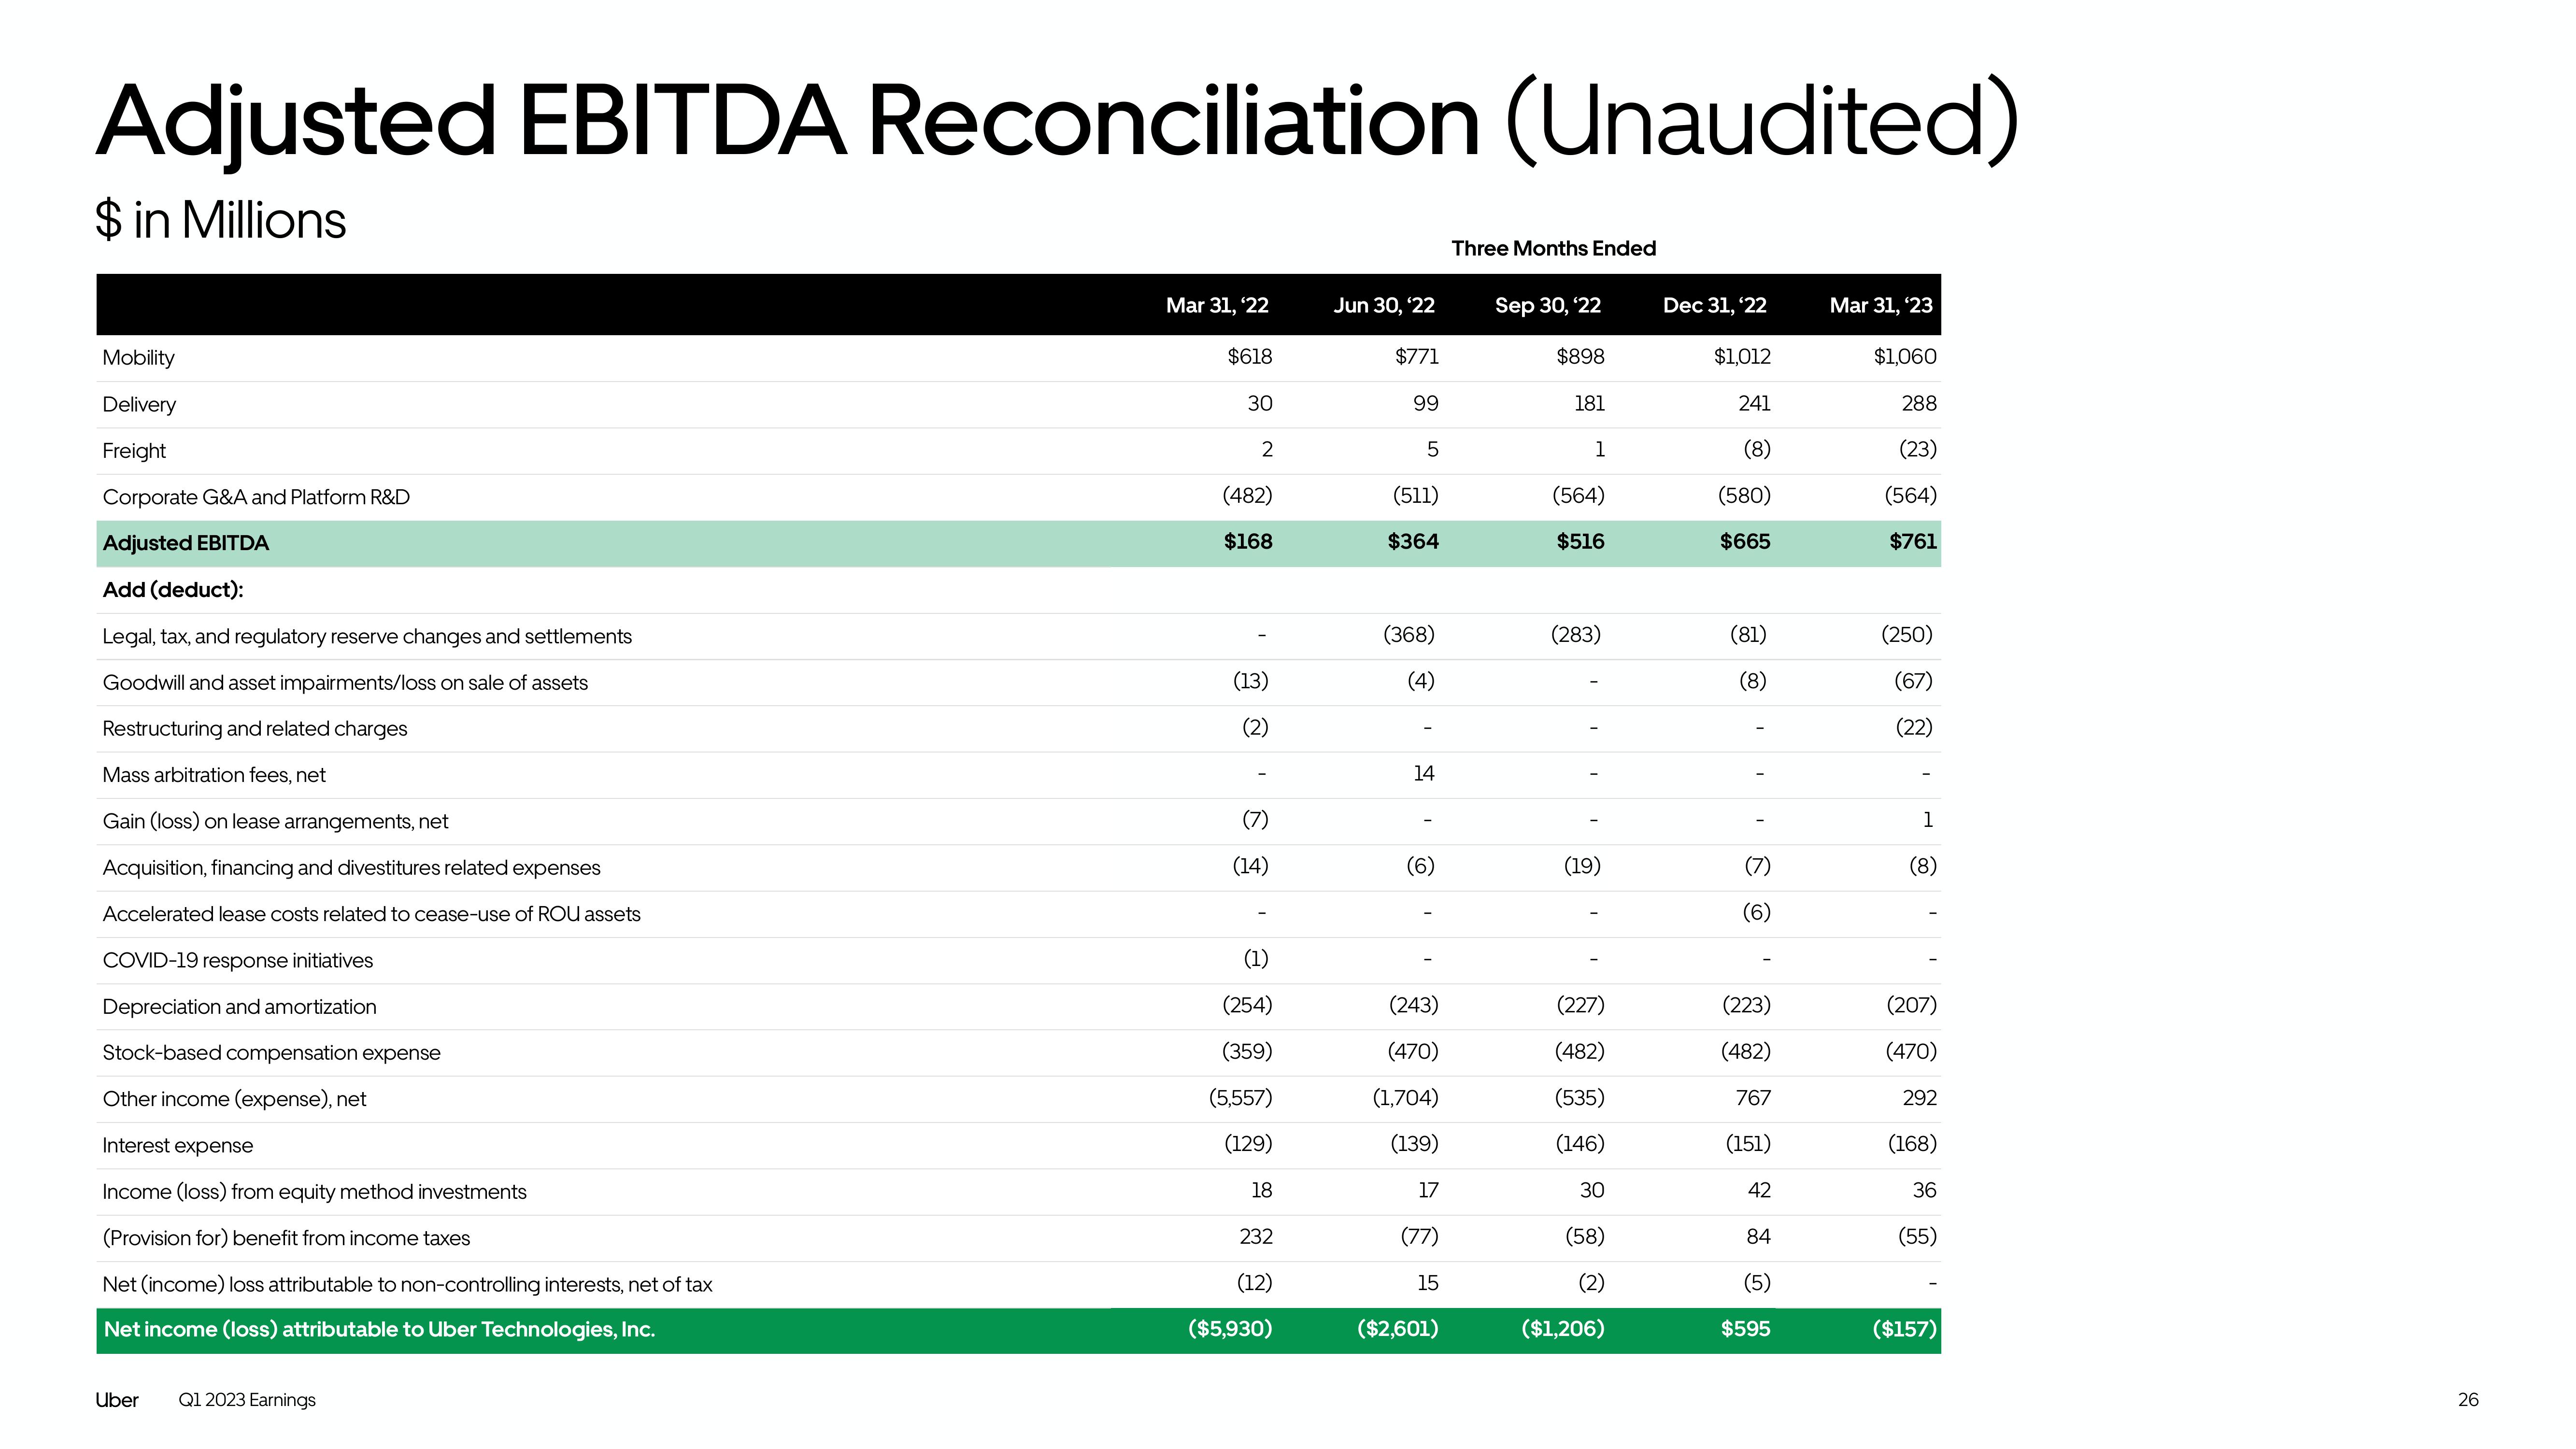
Adjusted EBITDA Reconciliation (Unaudited)
$ in Millions
Mobility
Delivery
Freight
Corporate G&A and Platform R&D
Adjusted EBITDA
Add (deduct):
Legal, tax, and regulatory reserve changes and settlements
Goodwill and asset impairments/loss on sale of assets
Restructuring and related charges
Mass arbitration fees, net
Gain (loss) on lease arrangements, net
Acquisition, financing and divestitures related expenses
Accelerated lease costs related to cease-use of ROU assets
COVID-19 response initiatives
Depreciation and amortization
Stock-based compensation expense
Other income (expense), net
Interest expense
Income (loss) from equity method investments
(Provision for) benefit from income taxes
Net (income) loss attributable to non-controlling interests, net of tax
Net income (loss) attributable to Uber Technologies, Inc.
Uber
Q1 2023 Earnings
Mar 31, '22
$618
30
2
(482)
$168
(13)
(2)
(7)
(14)
(1)
(254)
(359)
(5,557)
(129)
18
232
(12)
($5,930)
Jun 30, '22
$771
99
5
(511)
$364
(368)
(4)
14
(6)
(243)
(470)
(1,704)
(139)
17
(77)
15
($2,601)
Three Months Ended
Sep 30, '22
$898
181
1
(564)
$516
(283)
(19)
(227)
(482)
(535)
(146)
30
(58)
(2)
($1,206)
Dec 31, '22
$1,012
241
(8)
(580)
$665
(81)
(8)
(7)
(6)
(223)
(482)
767
(151)
42
84
(5)
$595
Mar 31, '23
$1,060
288
(23)
(564)
$761
(250)
(67)
(22)
1
(8)
(207)
(470)
292
(168)
36
(55)
($157)
26View entire presentation