Q2 Quarter 2023
Net Interest Income and Margin (FTE)
Net Interest Income
$ in millions; FTE
Net Interest Income Evolution
$ in millions; FTE
$199.8
$199.8
$191.2
$184.1
$169.3
$184.1
Illi
$
$18.2
$(20.8)
☐
$169.3
$(11.9)
($0.3)
☐
Q2 22
Q3 22
Q4 22
Q1 23
Q2 23
Q1 23
A in
Interest
Income
A in Interest
Expense -
Deposits
A in Interest
Expense -
Borrowings
A in
Accretion
Q2 23
(FTE)
excluding
accretion
Loan, Securities & Deposits Yield/Rate
5.67
5.89
5.40
4.86
4.54
Net Interest Margin/Earning Assets Yield
FTE (%)
FTE (%)
4.95
4.78
4.49
3.96
3.57
2.68
2.92
2.91
2.08
2.29
0.47
3.34
3.24
3.31
0.18
1.96
1.58
3.09
1.02
Q2 22
Q3 22
Q4 22
Q1 23
2.76
Q2 23
Q2 22
Q3 22
Q4 22
Loan Yield (FTE)
Q1 23
Securities (FTE)
Q2 23
-NIM
EA Yield
Cost of Deposits
FTE - Fully taxable equivalent using an effective tax rate of 26.135%
Totals may not foot due to rounding
Q2 23 Highlights
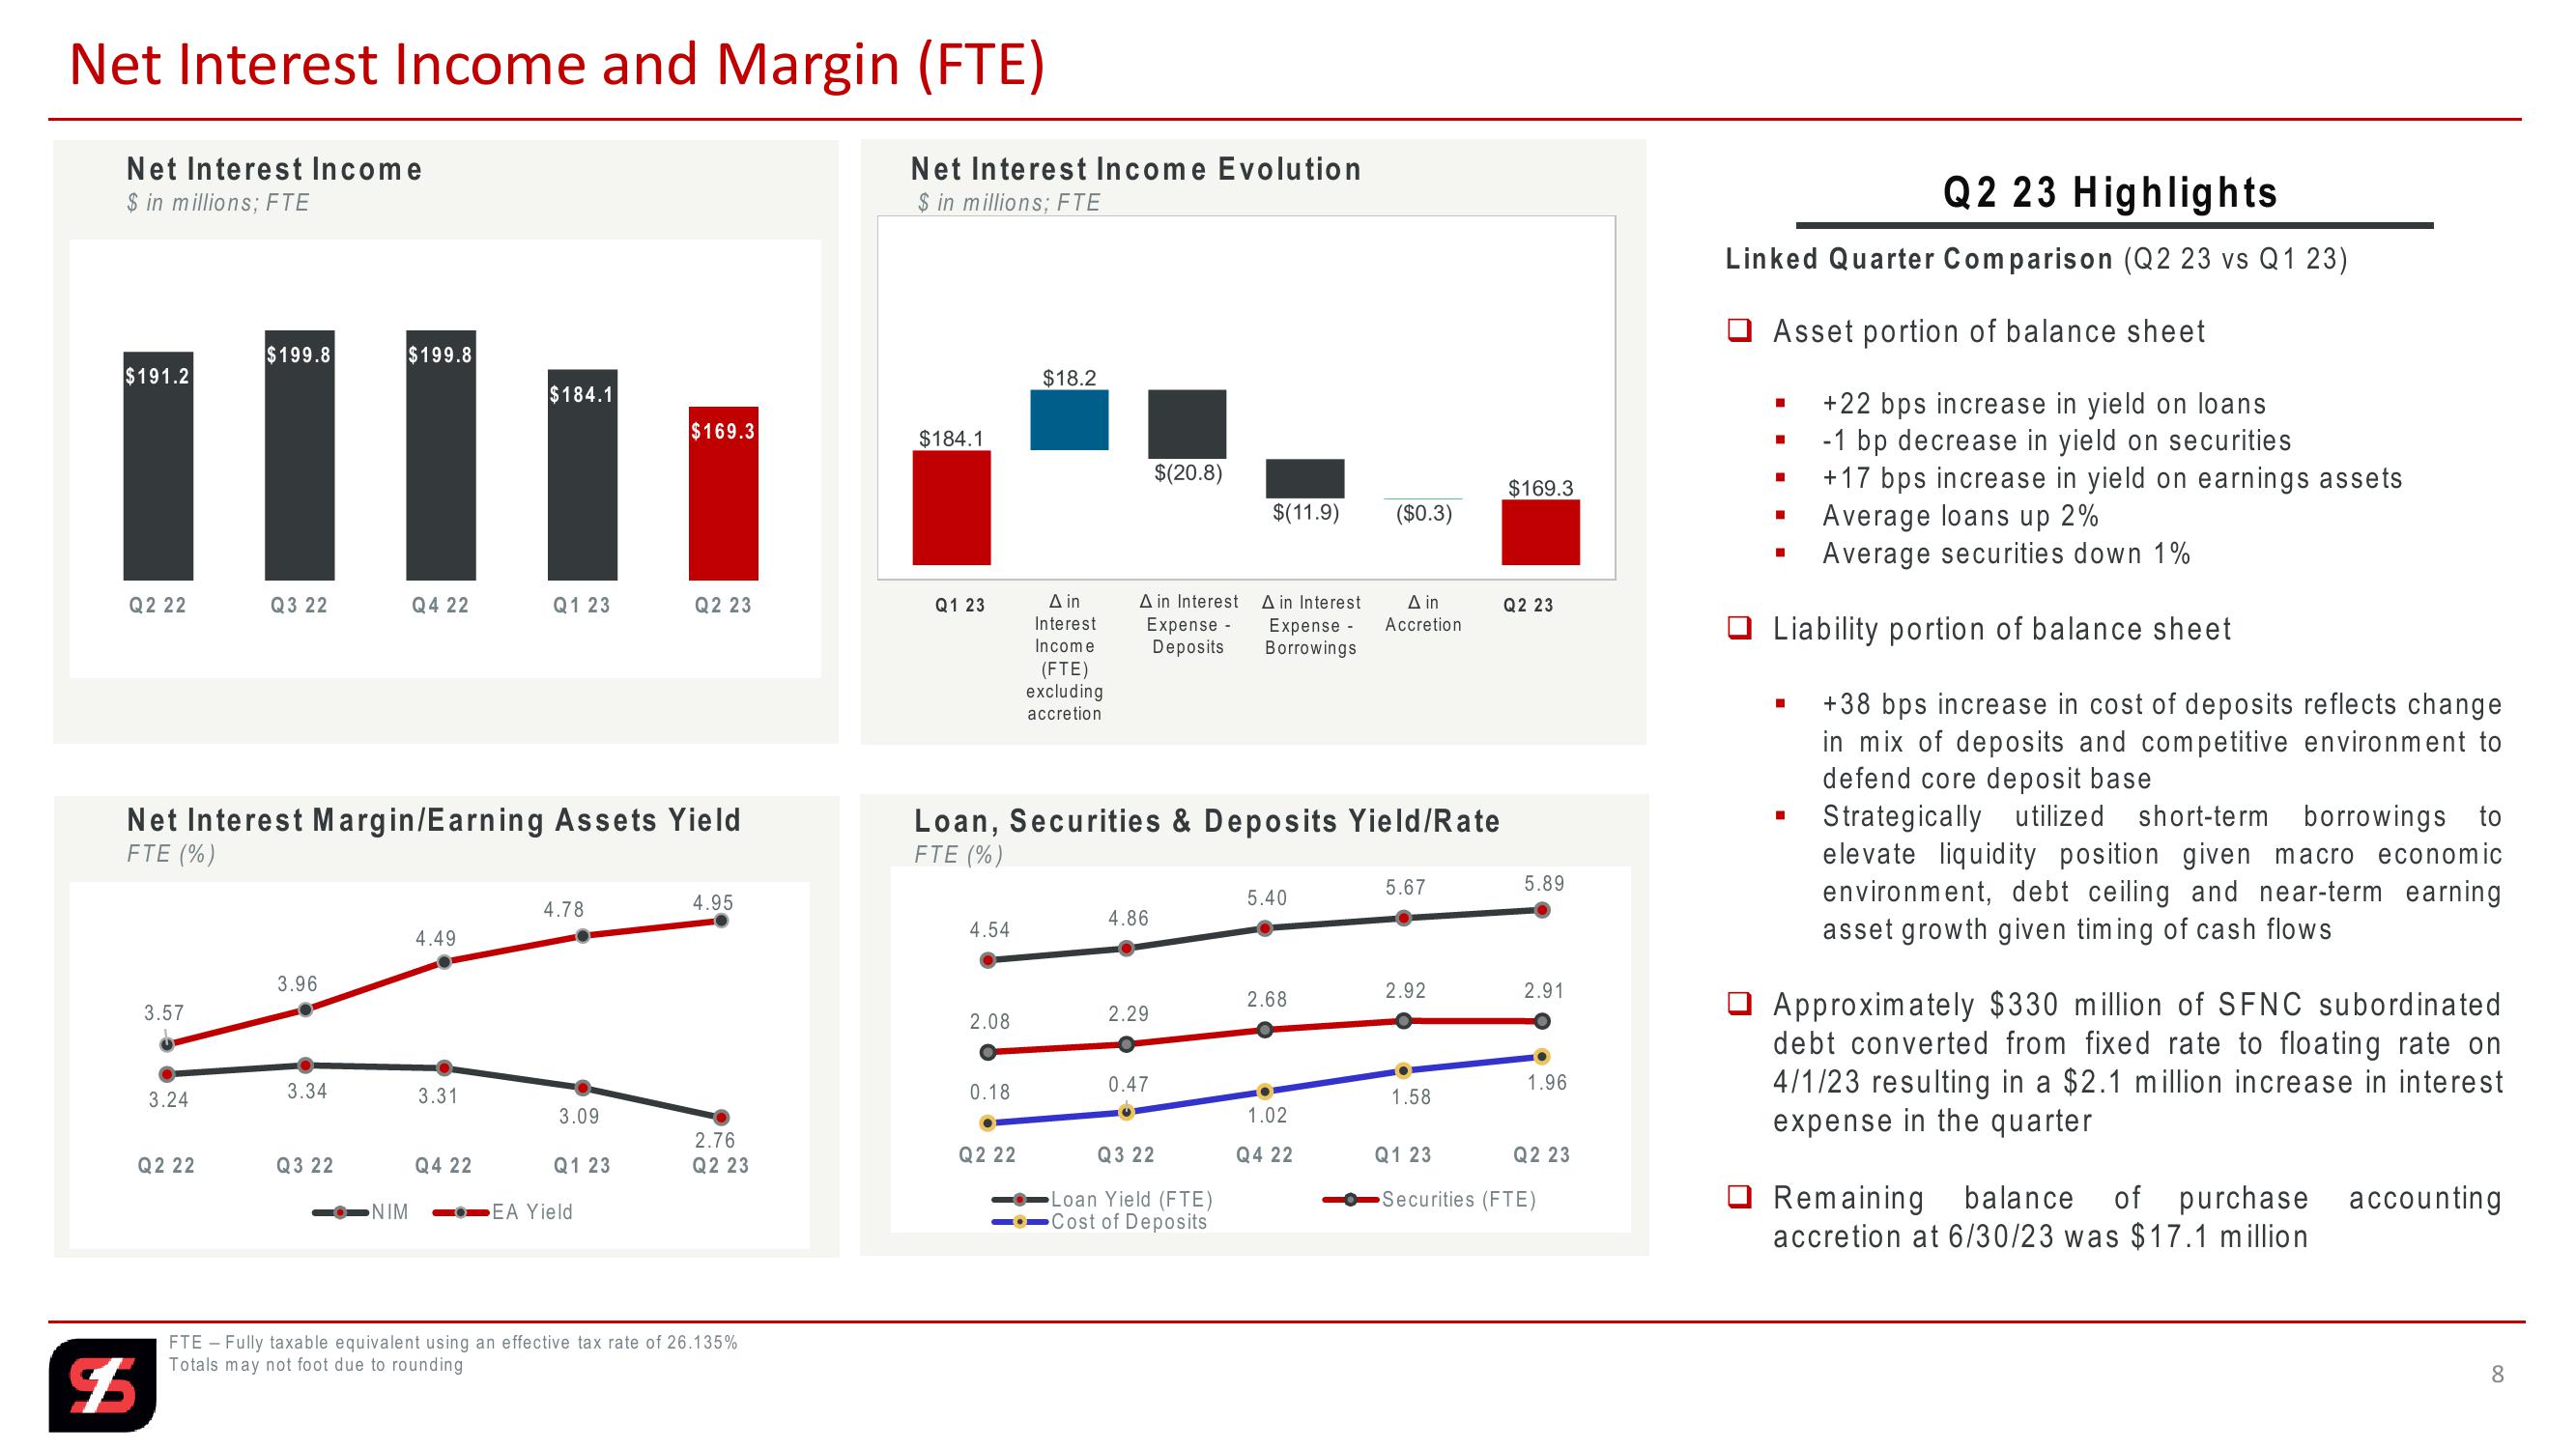
Linked Quarter Comparison (Q2 23 vs Q1 23)
☐ Asset portion of balance sheet
☐
◉
+22 bps increase in yield on loans
-1 bp decrease in yield on securities
+17 bps increase in yield on earnings assets
Average loans up 2%
Average securities down 1%
Liability portion of balance sheet
☐
+38 bps increase in cost of deposits reflects change
in mix of deposits and competitive environment to
defend core deposit base
Strategically utilized short-term borrowings to
elevate liquidity position given macro economic
environment, debt ceiling and near-term earning
asset growth given timing of cash flows
Approximately $330 million of SFNC subordinated
debt converted from fixed rate to floating rate on
4/1/23 resulting in a $2.1 million increase in interest
expense in the quarter
Remaining balance of purchase
accretion at 6/30/23 was $17.1 million
accounting
8View entire presentation