Salesforce Shareholder Engagement Presentation Deck
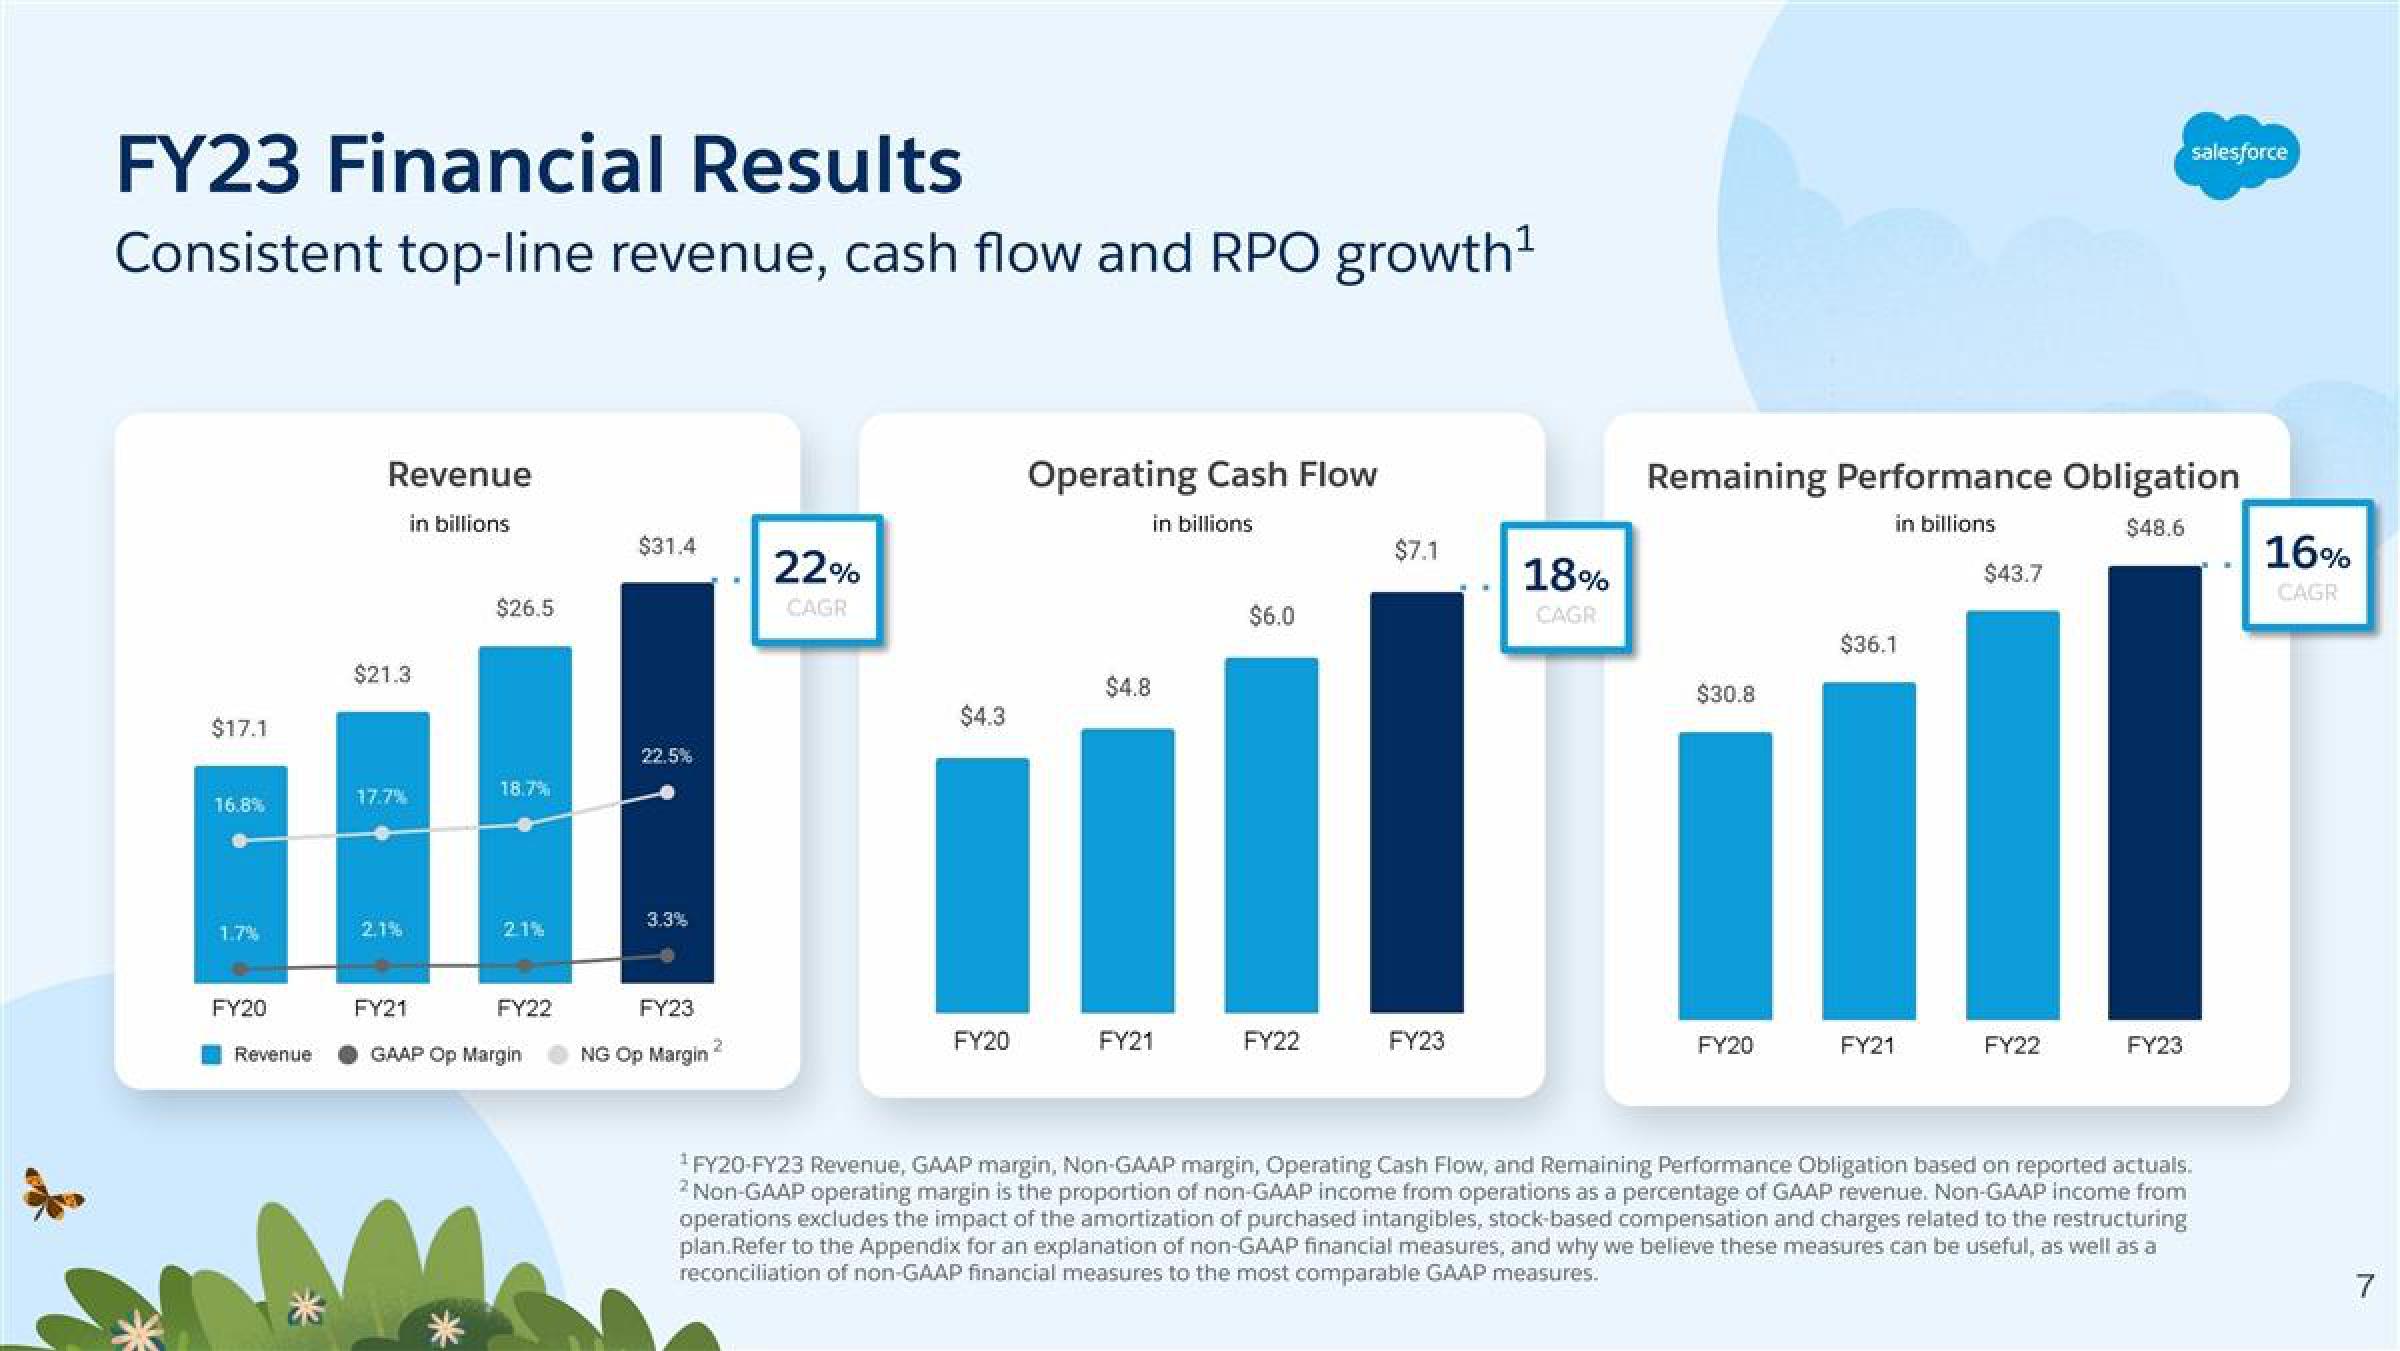
FY23 Financial Results
Consistent top-line revenue, cash flow and RPO growth¹
$17.1
16.8%
1.7%
FY20
Revenue
Revenue
in billions
$21.3
17.7%
2.1%
FY21
$26.5
18.7%
2.1%
FY22
GAAP Op Margin
$31.4
22.5%
3.3%
FY23
NG Op Margin
2
22%
CAGR
$4.3
FY20
Operating Cash Flow
in billions.
$4.8
FY21
$6.0
FY22
$7.1
FY23
18%
CAGR
Remaining Performance Obligation
in billions
$48.6
$30.8
FY20
$36.1
FY21
$43.7
FY22
salesforce
FY23
FY20-FY23 Revenue, GAAP margin, Non-GAAP margin, Operating Cash Flow, and Remaining Performance Obligation based on reported actuals.
2 Non-GAAP operating margin is the proportion of non-GAAP income from operations as a percentage of GAAP revenue. Non-GAAP income from
operations excludes the impact of the amortization of purchased intangibles, stock-based compensation and charges related to the restructuring
plan.Refer to the Appendix for an explanation of non-GAAP financial measures, and why we believe these measures can be useful, as well as a
reconciliation of non-GAAP financial measures to the most comparable GAAP measures.
16%
CAGR
7View entire presentation