Selina SPAC slide image

Selina SPAC

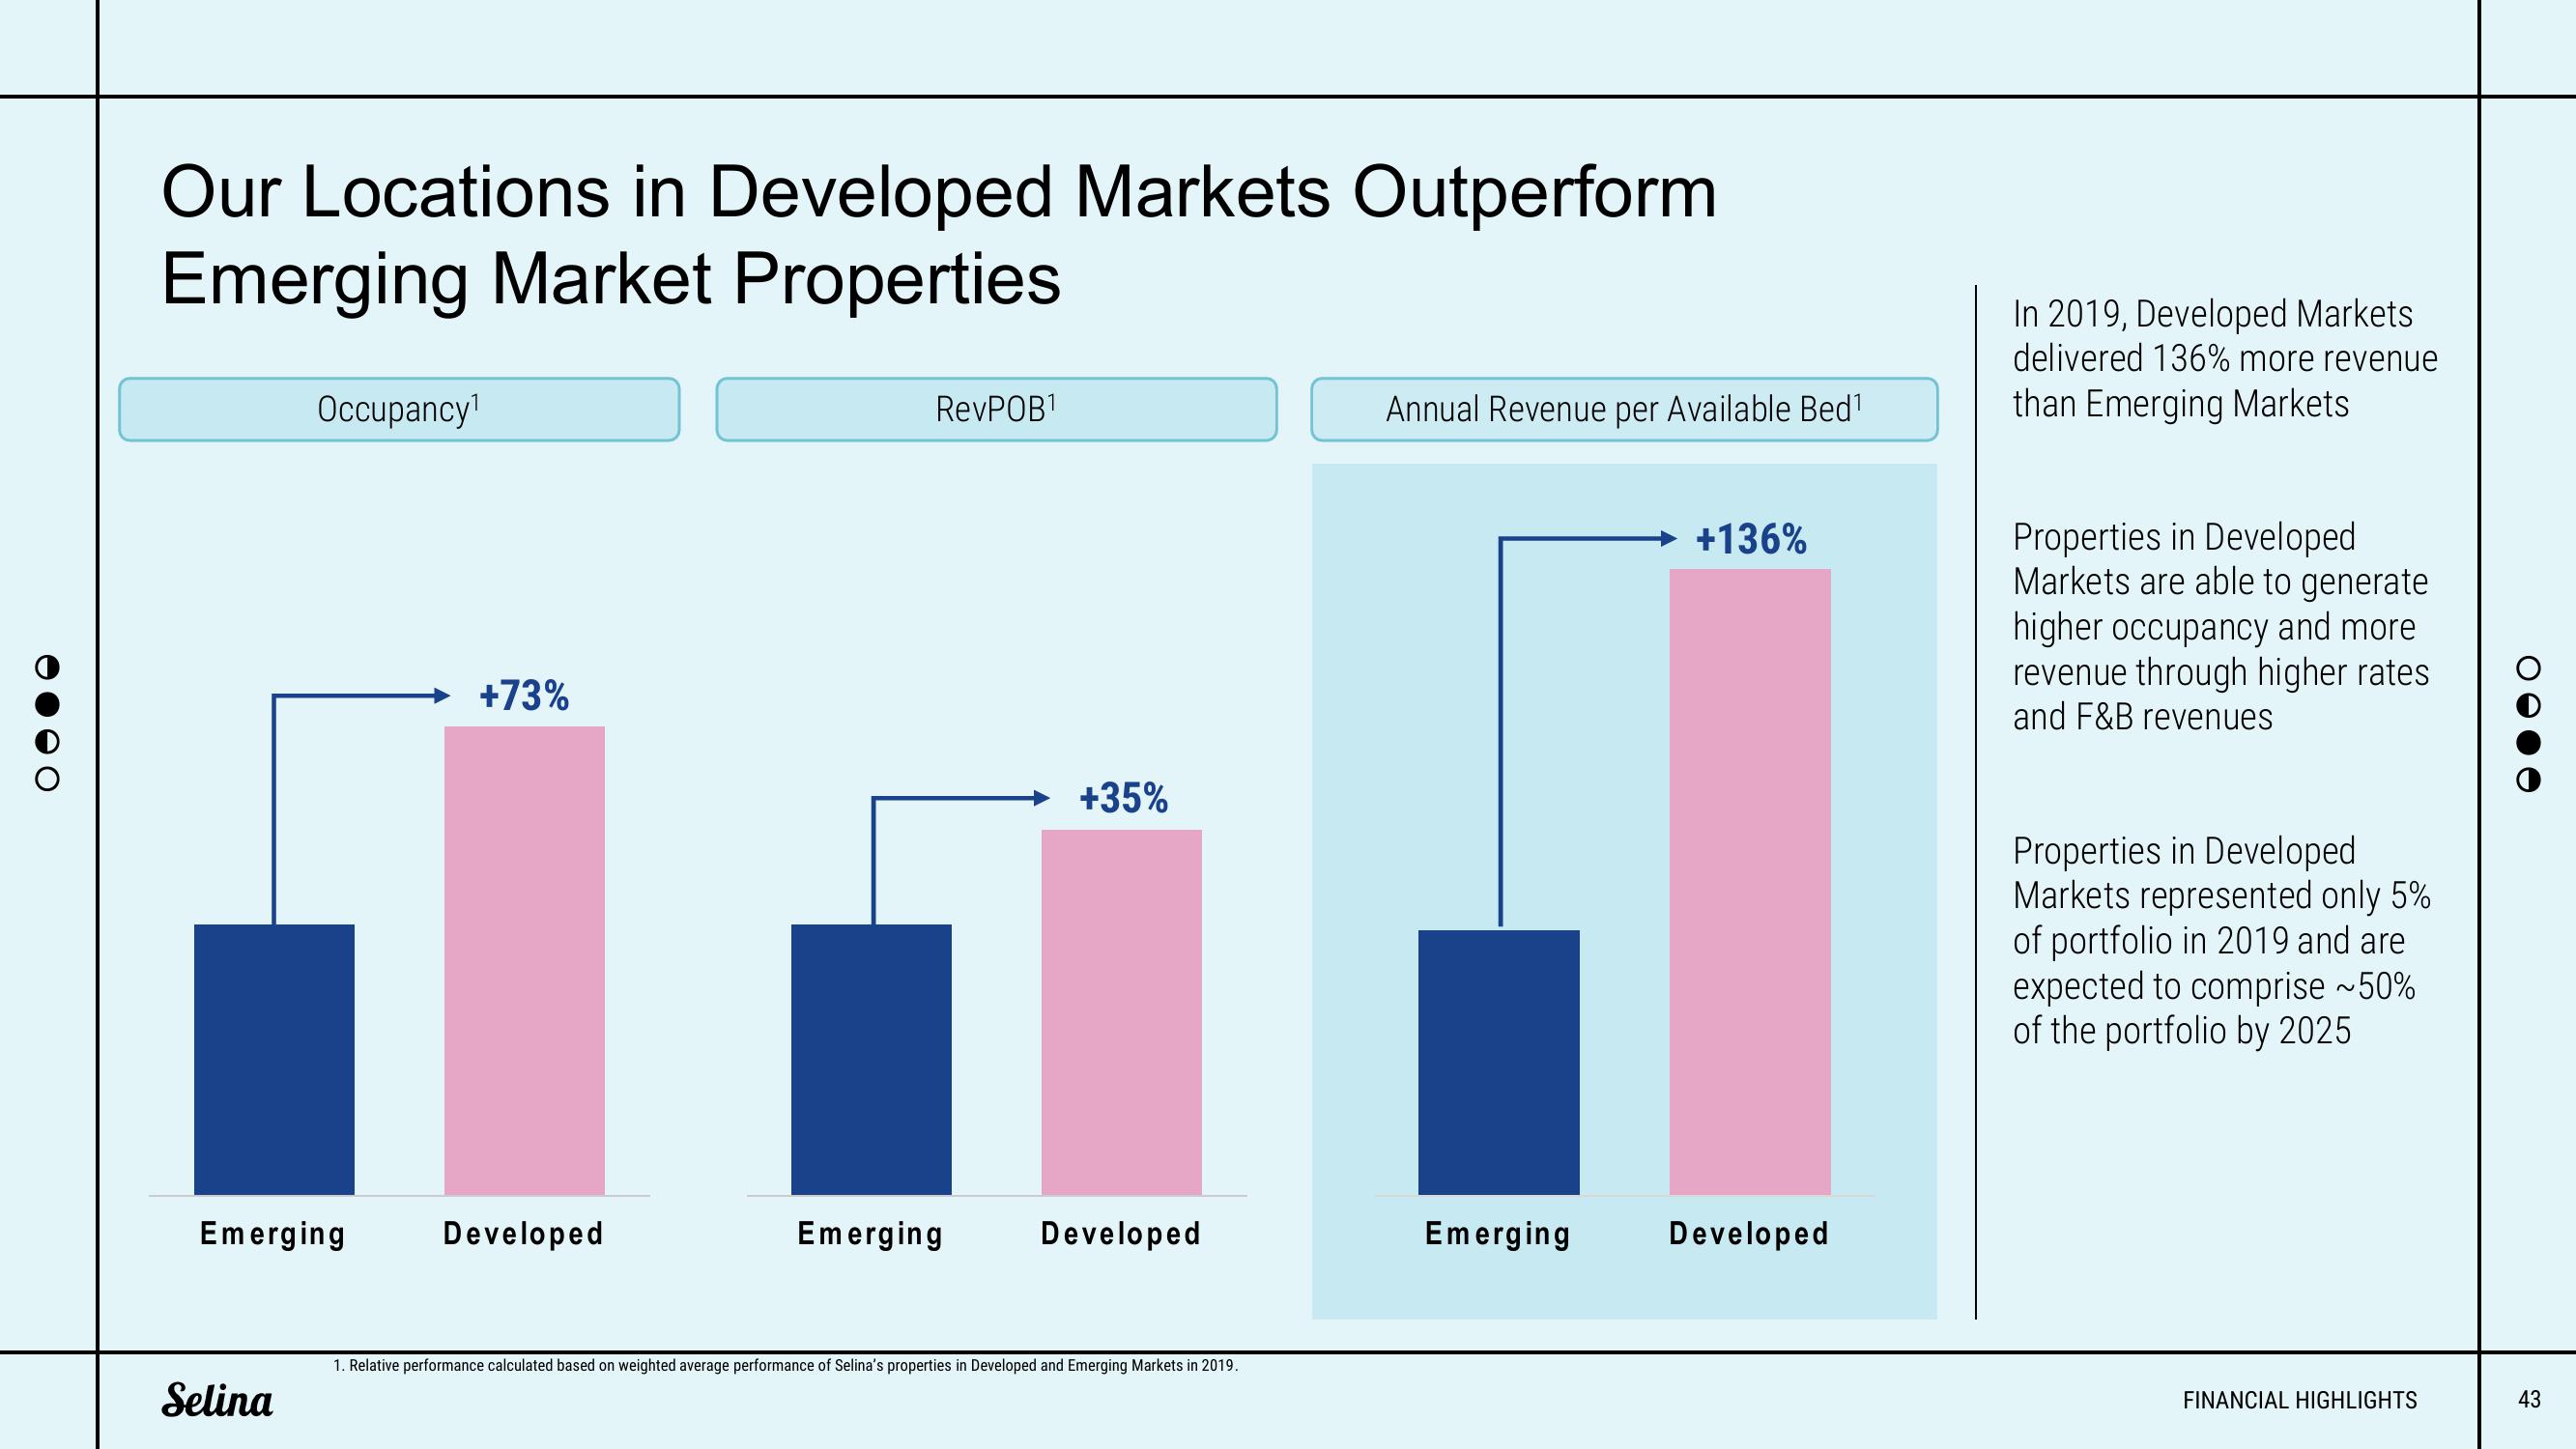
Our Locations in Developed Markets Outperform Emerging Market Properties Occupancy¹ Emerging Selina +73% Developed RevPOB¹ Emerging +35% Developed 1. Relative performance calculated based on weighted average performance of Selina's properties in Developed and Emerging Markets in 2019. Annual Revenue per Available Bed¹ Emerging +136% Developed In 2019, Developed Markets delivered 136% more revenue than Emerging Markets Properties in Developed Markets are able to generate higher occupancy and more through higher rates revenue and F&B revenues Properties in Developed Markets represented only 5% of portfolio in 2019 and are expected to comprise ~50% of the portfolio by 2025 FINANCIAL HIGHLIGHTS 43
View entire presentation